Useful Tip:
The platform provides full extended hours trade data from the beginning of pre-market at 4:00am ET until end of after-hours close at 8:00pm ET
Please take a moment to review so you can quickly start using MOMO Pro to its fullest. Visit mometic.com or blog.mometic.com for additional tips and information.
MOMO was built to discover new stocks and uncover trades before your competition (other traders). MOMO Pro is our latest platform designed to provide the best visibility to stocks making meaningful moves. MOMO Pro works by examining the price action on over 10,000 equities across Nasdaq, NYSE and AMEX and then streaming the intraday breakout activity in real-time. Armed with this unique capability, you can quickly monitor and identify trading opportunities previously unaware to you.
MOMO Pro is focused on delivering market action so you can profit. There are a host of other tools that provide charting and trade execution, but MOMO Pro is purpose-built on scanning the US markets to uncover your next winning trade.
The standard version of MOMO provides the familiar new high / new low capabilities found in the first version of MOMOweb, but with a significantly improved interface to make MOMO more accesible regardless of device.
MOMO Pro takes trade discovery to the next level, by providing Discovery -- a sortable and filterable view that captures, scans, stocks which you are likely going to want to take action upon. The new sortable view enables you to now look at stocks making movement beyond higher highs or lower lows, but to also include those with total highest momentum, unusual volume, percent change, and VWAP dist.
MOMO Pro+ includes special features to identify stocks exiting consolidation (squeeze) patterns and build queries based on trend, gaps, and significant money flows. Additional technical indicators include short interest ratio (DTC) as well as Average True Range (ATR%). MOMO Pro+ includes conditional alert notifications using available MOMO criteria to build alerts which return symbols based on condition. MOMO Pro+ also provides the availabilty to access alerts with our webhook API.
The entire platform is optimized it to be fully re-sizable to support a wide range of resolutions and devices - whether Windows, MacOS, Android or iOS.
If you have not signed up yet, you may do so at momo.mometic.com/register. There are 3 available plans. MOMO, Pro, and Pro+. Plans are offered in both monthly and discounted annual options. If you have any questions, email us at hello@mometic.com or try our online chat.
MOMO works by evaluating the entire US stock market in realtime to continually uncover the equities that are making moves. MOMO is active during market and extended hours. You may still use MOMO outside of the hours, but the MOMO Stream functionality will be idle as there are no new trades are taking place. Discovery and other elements are available regardless of market status.
The platform provides full extended hours trade data from the beginning of pre-market at 4:00am ET until end of after-hours close at 8:00pm ET
Before we dive into the functionality, take a look at the menuing and layout manager. Within your browser or when deployed as a PWA the MOMO components will automatically resize and stack to fit your needs across devices.
The top menu bar is used for adding and removing components. Use the left arrows and right arrows to display items off page. Unselected items return to the "+ MORE" menu folder.
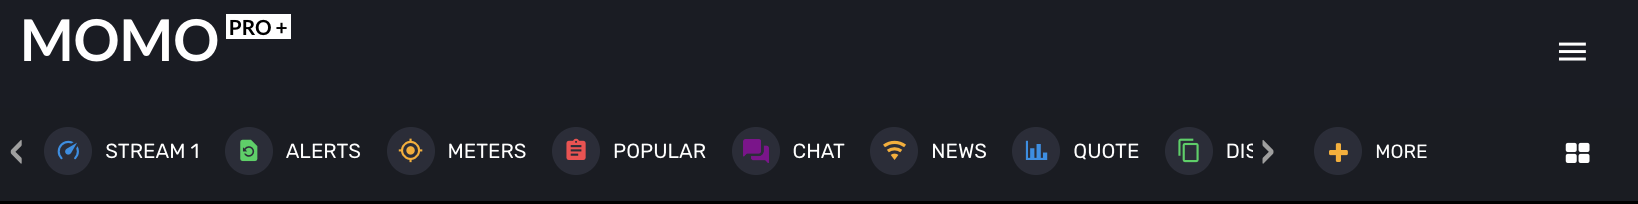
MOMO Pro also includes advanced layout management to enable you to detach, resize and close components to support using MOMO on multiple screens and layouts.
Each of these 9 available components make up MOMO Pro. If only subscribe to the MOMO basic plan, the Discovery components will not be displayed. You may upgrade at any time to receive this capability.
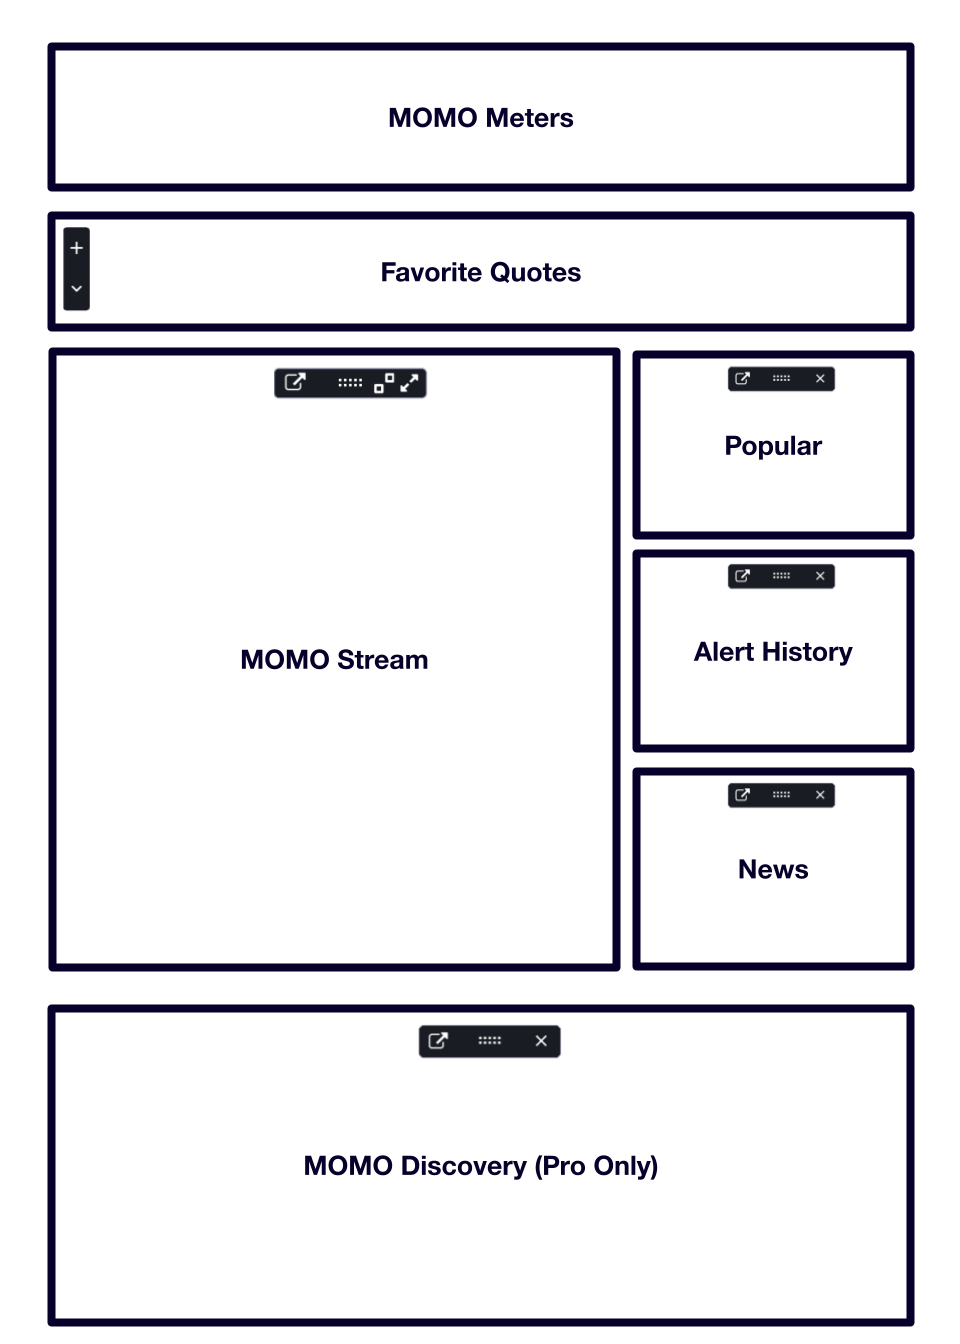
When you first start MOMO Pro you will see the default layout. This is our Dynamic layout and is responsive to particular window sizes and layouts for that “web app” experience. The layout menu is accessed from the layout manager ![]() on top right of Dashboard.
on top right of Dashboard.
You will notice most windows have layout toolbars. These are used to arrange and pop-out windows from MOMO Dashboard.
At any time you may detach a window by clicking the leftmost detach icon in the toolbar. You can move and save the layout with one or more components spread across screens as illustrated below.
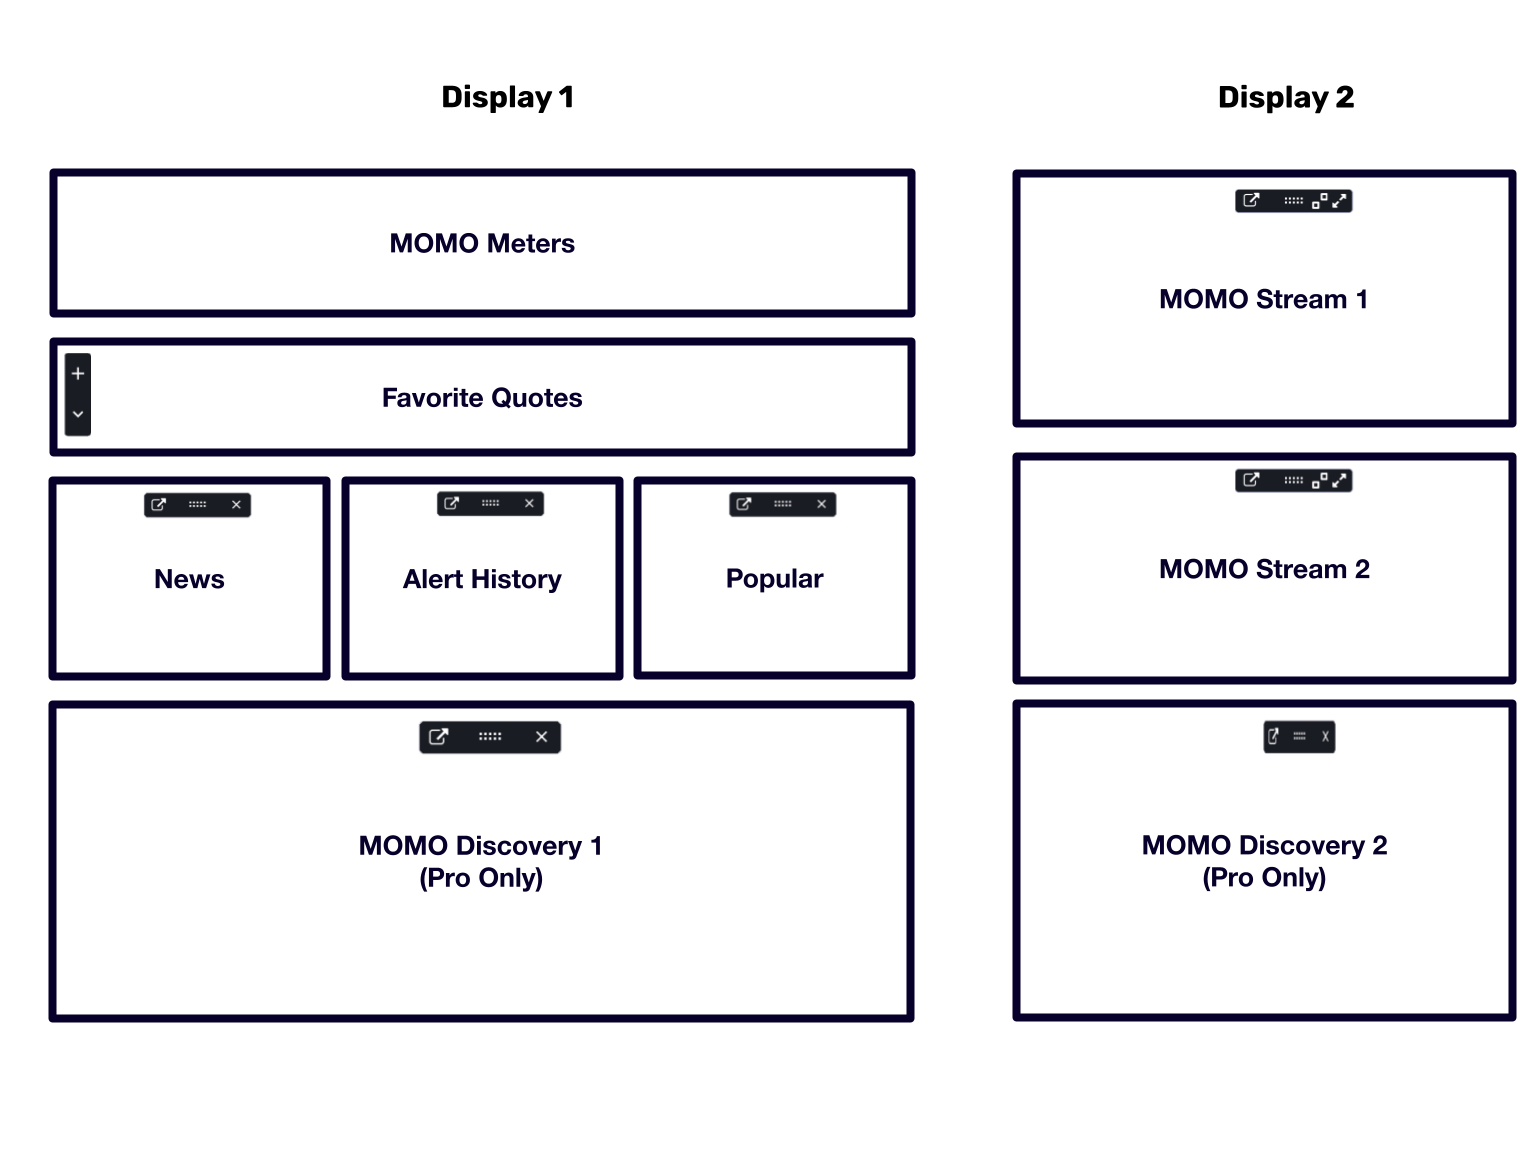
Everyone has different layout needs, screen resolution and device types. You can customize MOMO Pro in a variety of ways to meet your needs.
MOMO includes several features to help uncover and track stock discoveries. The following sections detail the functionality for each.
The MOMO Meters show a rolling market breadth over a 3 min period. Each row represents the current number of winners to losers for the Dow, Nasdaq, and SPY. How to use the MOMO Meters: Markets can change direction quickly and swings based on index percentage changes are slow to highlight this swing especially particularly since indexes are cap weighted.
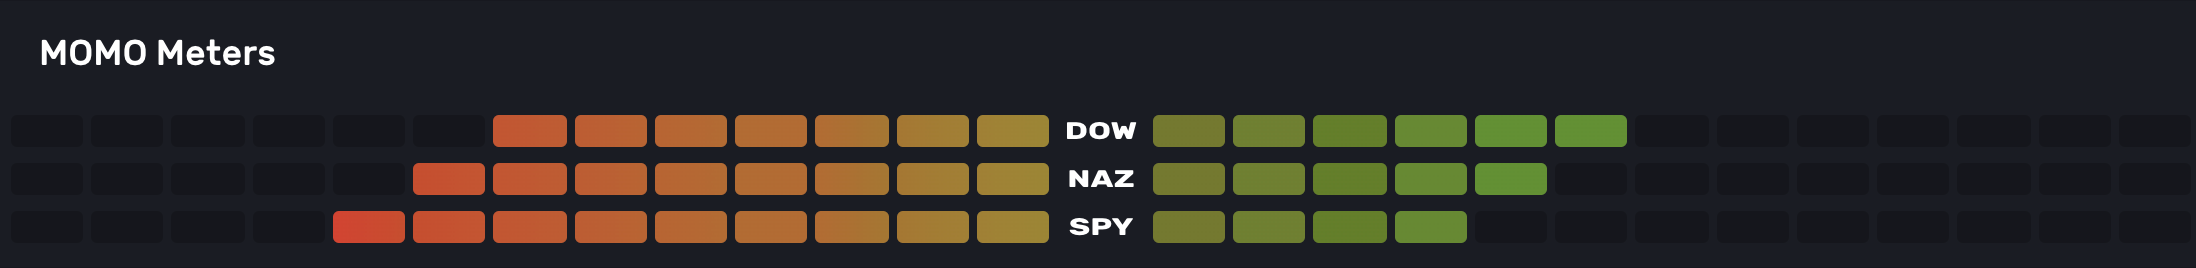
Located on the top of the MOMO screen, the MOMO Meters let you quickly identify market bias and flows. On either side of the MOMO logo are three sets of gauges. These gauges represent activity from top to bottom for the Dow, Nasdaq, and S&P 500. Specifically, the MOMO Meters are a visualization of those making new intraday highs vs. lows. For example, if the S&P 500 had a combined ten stocks making either a new high or low and 8 of them during the period were highs, the bottom MOMO Meter would be 80% green and 20% red.
Uncover a stock and add to quotes to keep tabs on the movement. If you add as a favorite in Discovery MOMO will also include as a Quote. Quotes are integrated throughout MOMO Pro to help you track activity in Stream, News and Discovery.
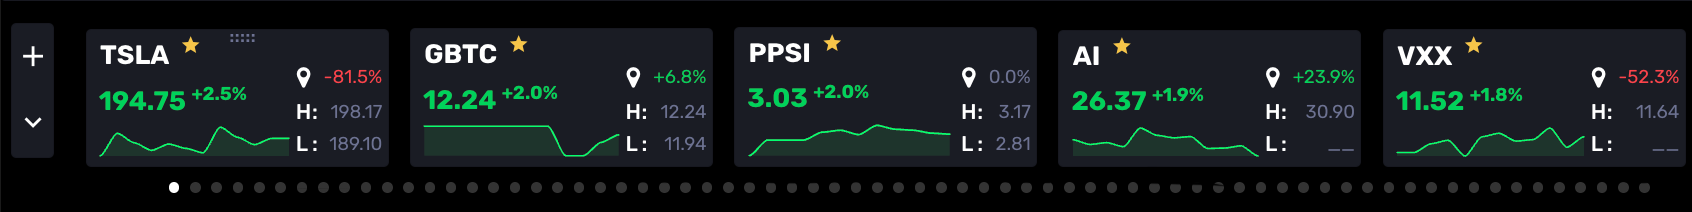
Swipe or drag left or right to review all quotes that have been added. To remove a quote select the star. To add a quote, click on the "+" indicator in the lefthand window. H and L are daily high and low values. The "Pin" icon represents the gain or loss since you started tracking the symbol and can be reset by clicking the icon.
The down arrow " " provides way to fully expand all quotes for quick reference as shown below. Tap the up arrow " " to collapse.
You may also change the sort order by expanding the control in top left corner as shown.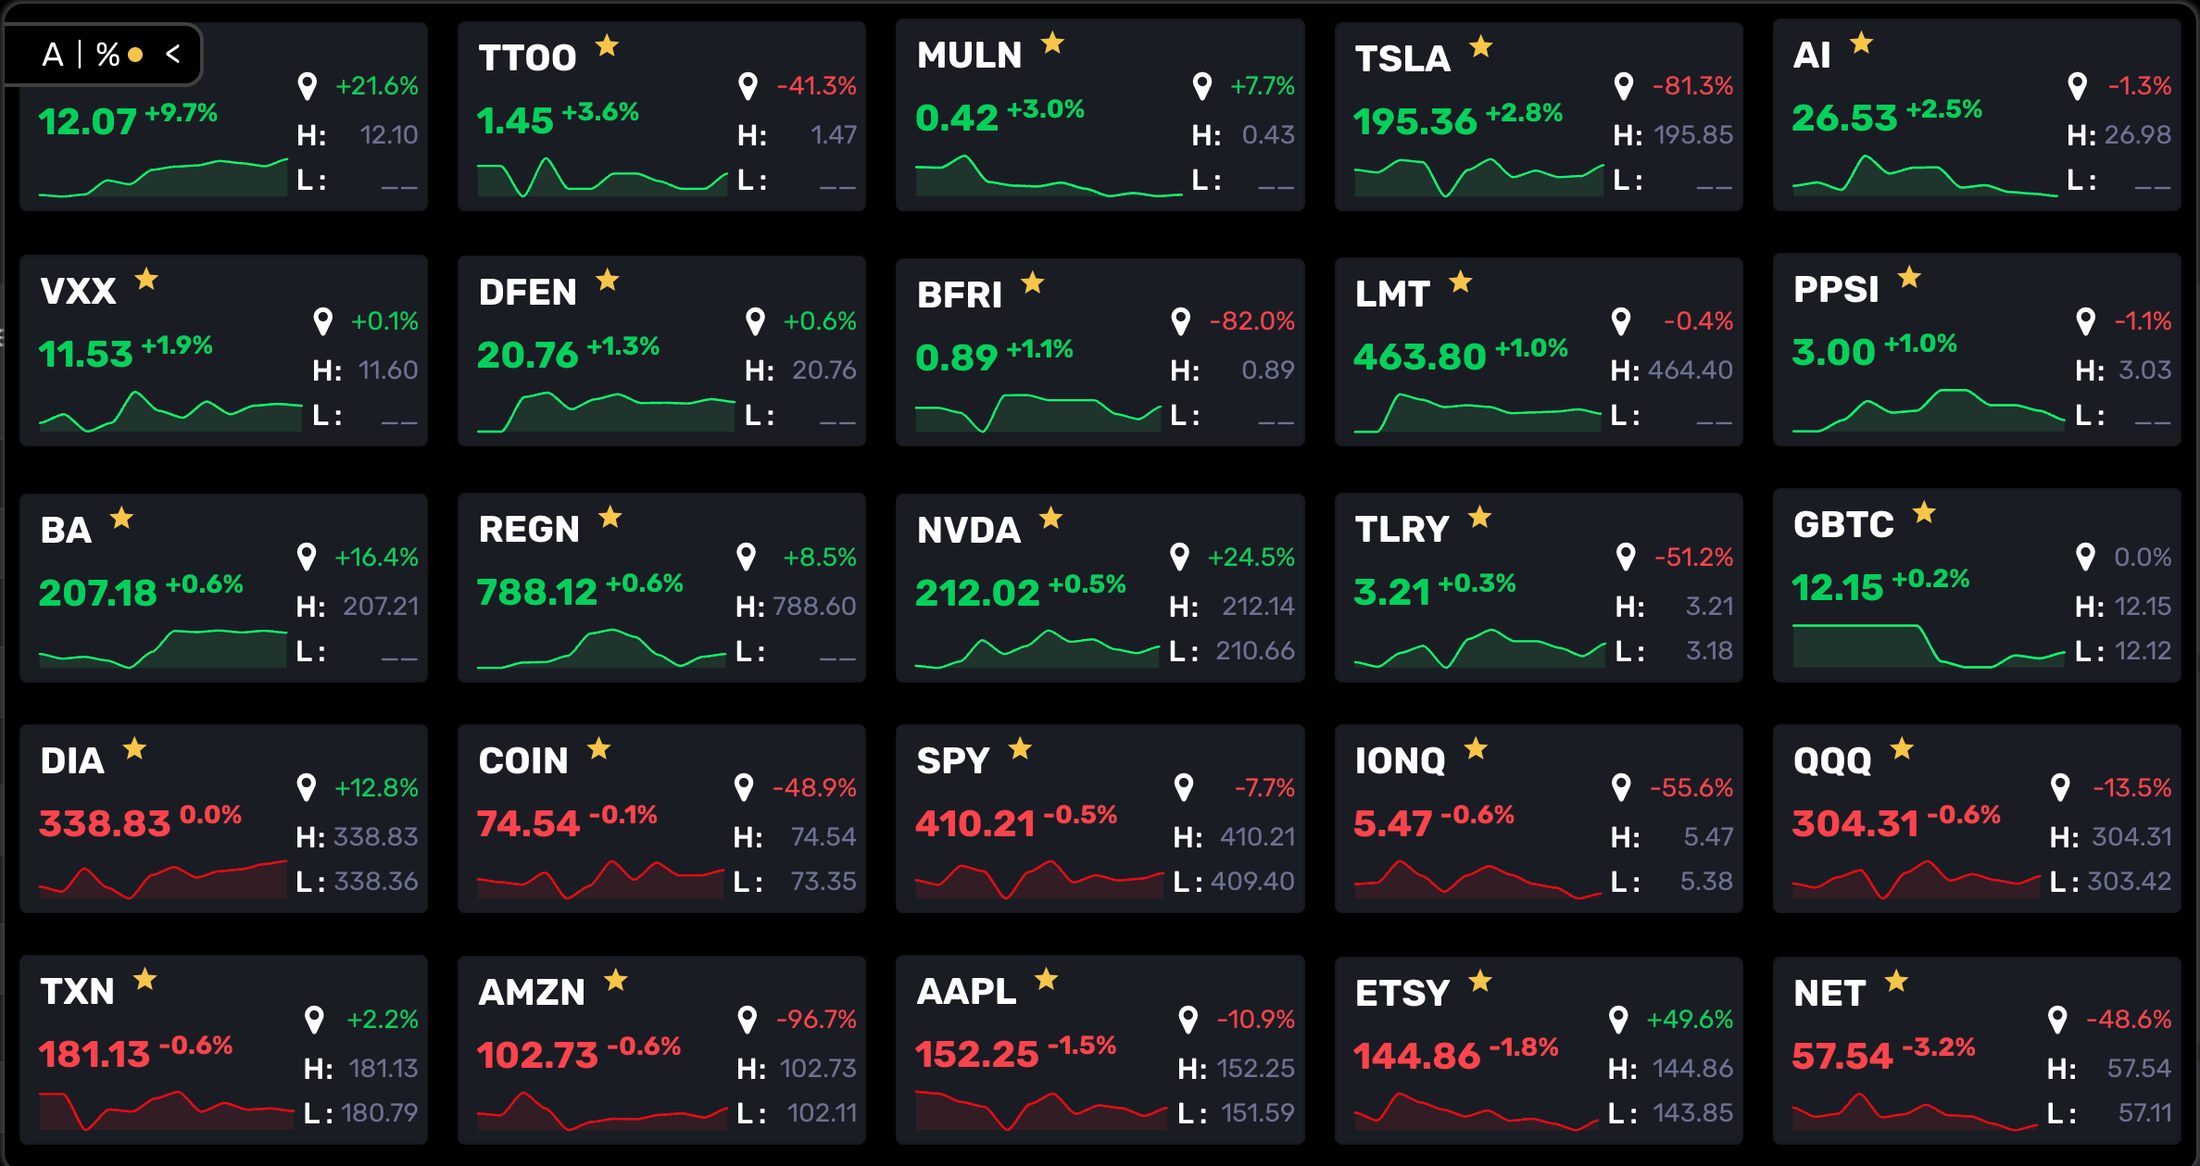
The MOMO Stream scans for new highs and new lows in realtime. The Stream is divided into two columns. The red column on the left-hand side shows new lows for the day and the right-hand green column shows new daily highs.
MOMO Stream cand display two Streams simultaneously. By default, Stream 1 is set for Filter and the Stream 2 is disabled. When Stream 2 enabled configure as needed in Stream 2 Settings. You will have option to toggle between Streams as needed. After configuring the Stream 2 you can arrange as needed and save in the Layout Manager. See Stream Settings for additional details.
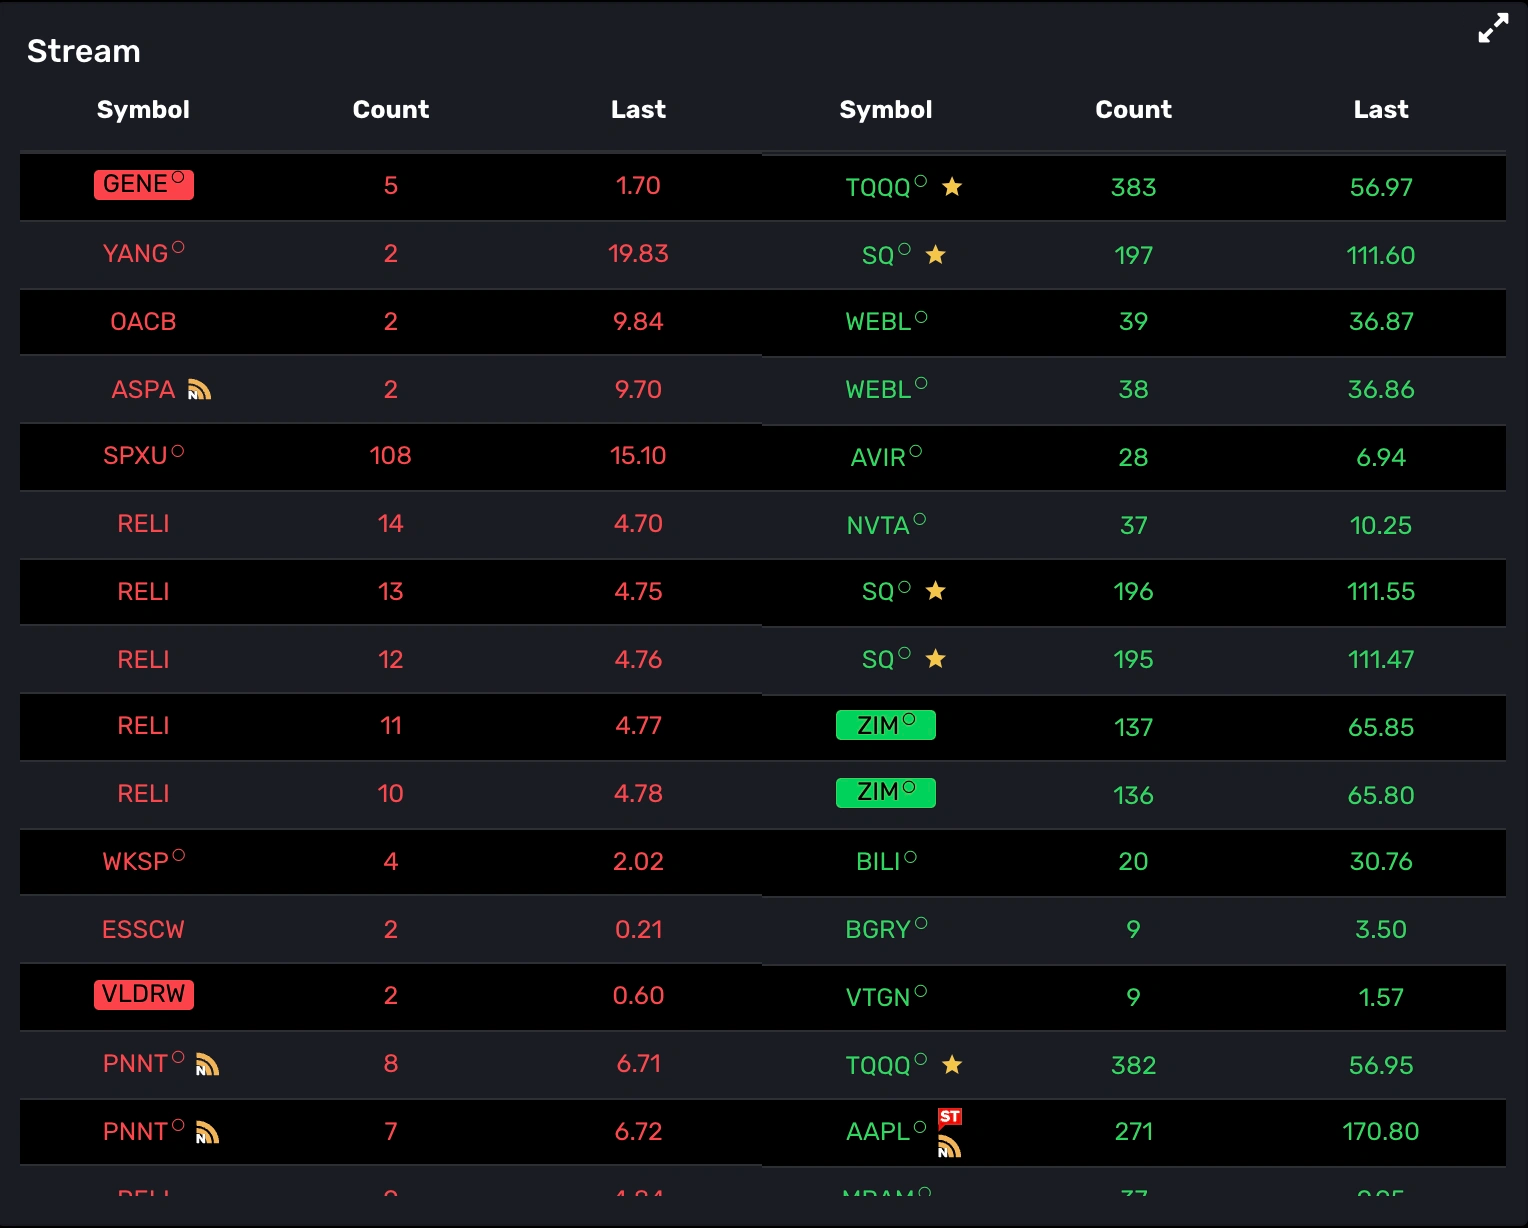
Both the left and right columns in the data stream display the following data:
MOMO doesn’t differentiate whether the 52wk high/low is reached in normal trading hours or in extended hours, but will reset the 52 week value nightly based on what Nasdaq recognizes as the 52 week high or low. For example, if AAPL has a prior 52 week high of $178 and reaches $180.00 during premarket, MOMO will highlight that as a new 52 week high in the MOMO stream. But if during normal market hours AAPL only reaches $175 and, not a new 52week high, $178 will remain the 52 week high on record.
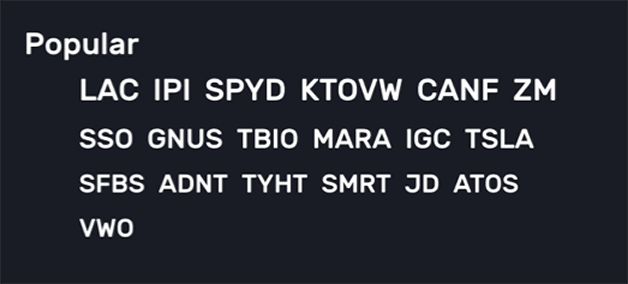
MOMO is built to help highlight stocks stand out. Popular simply presents stocks which other users are actively researching and engaging with. Click on any the listed symbols to open the action window to research or set an alert.
Browser notifications are easy to miss and quickly disappear. Alert history solves this problem so you can review alerts as needed.

MOMO provides up to the second news on entire market, only your favorite quotes, any symbol searched upon, and automatically when any symbol is clicked on within the platform.
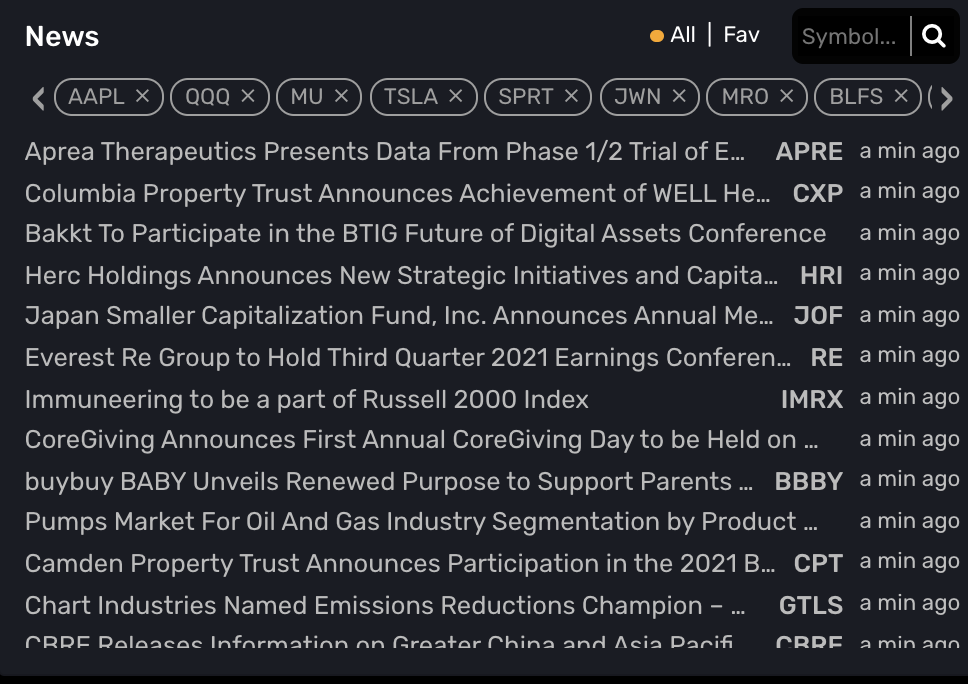
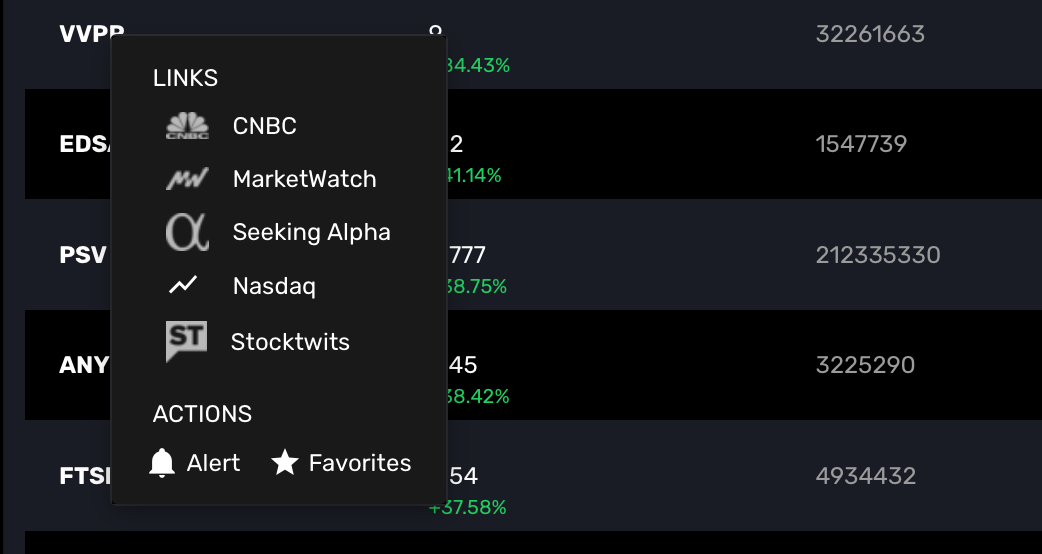
Within MOMO you may launch popular media sources to help find news and data supporting the price movement. Once selected, MOMO will launch a new browser tab for the desired news and stock symbol.
You may also use the menu to add as a Favorite or quickly add an alert.
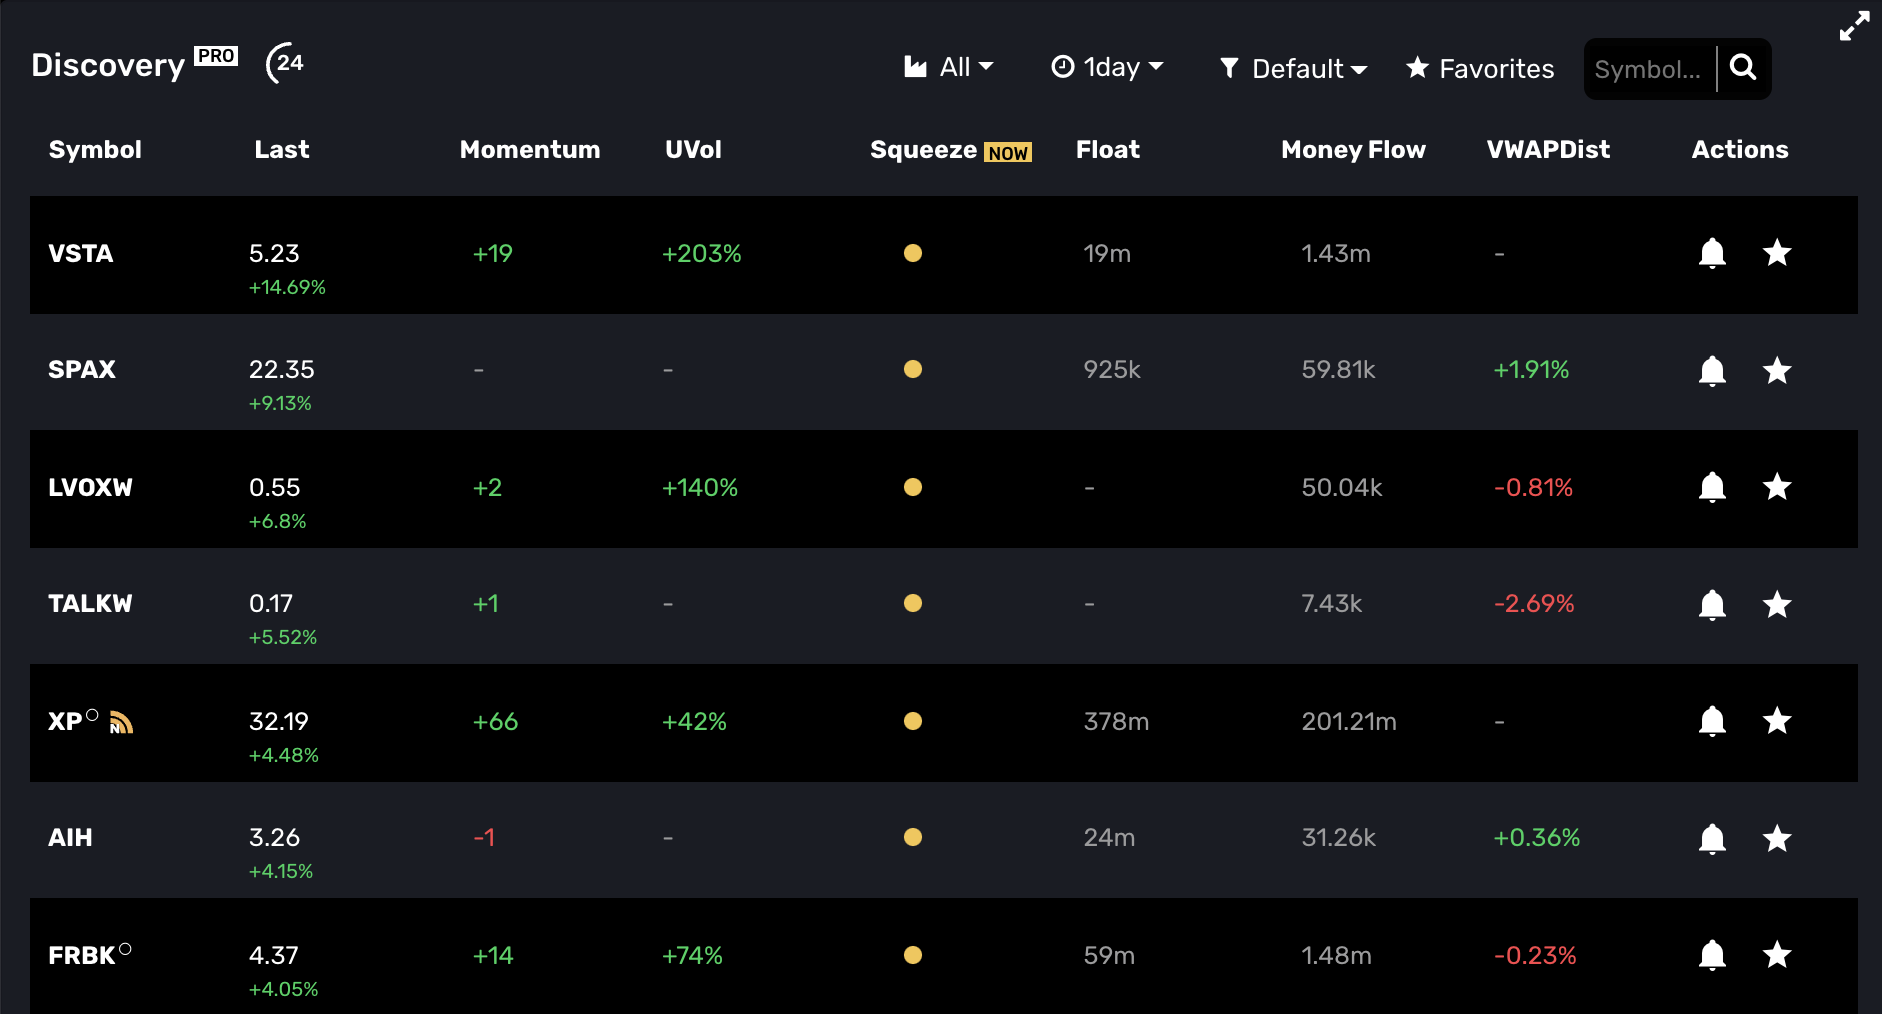
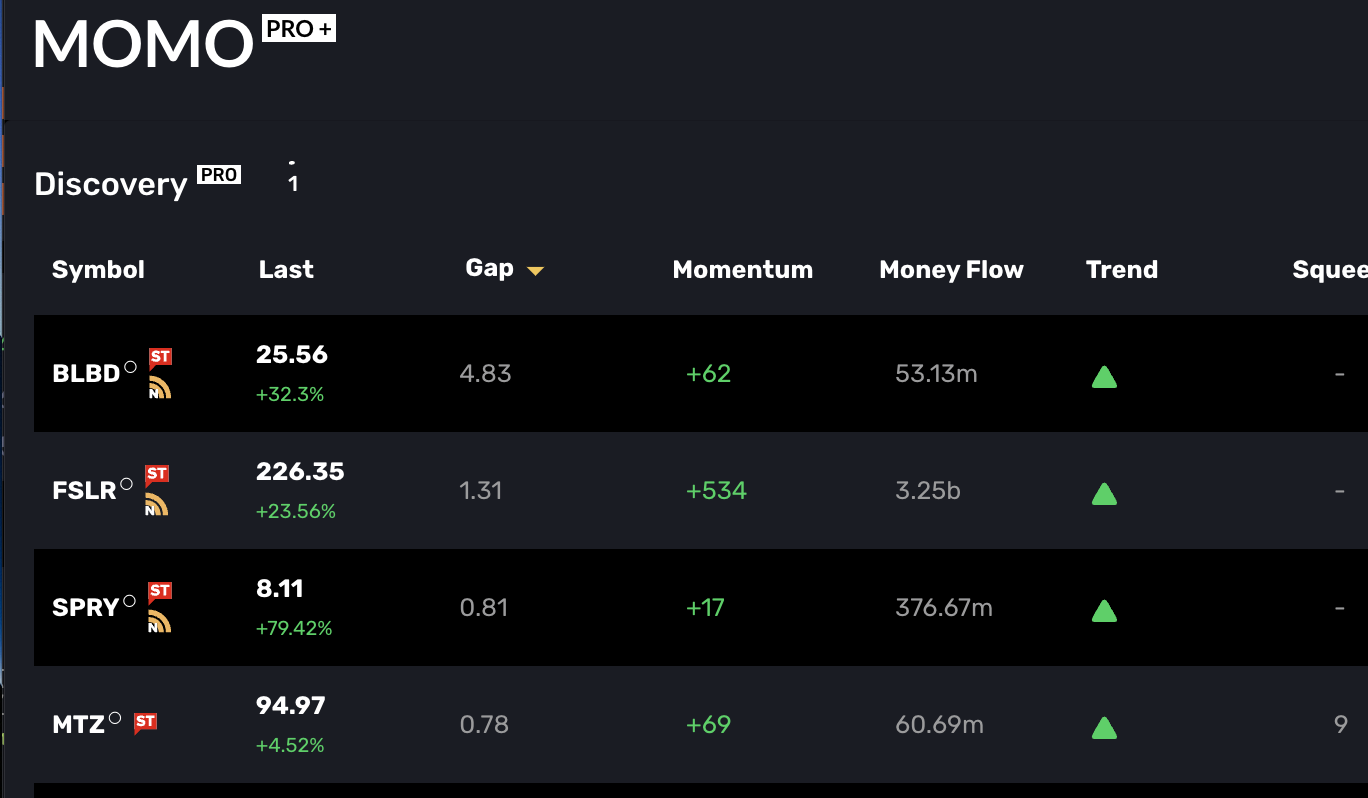
With your MOMO Pro subscription, you will have the Discovery feature enabled. Discovery provides a more comprehensive way of presenting data and the sortable fields uniquely highlight opportunities on their own merits. Search by stock, filter by industry or select your favorites to uncover notable movements on new stocks or keep close tabs on those you closely follow.
Discovery updates with live pricing and analytics every 30 seconds to keep you up to date on the biggest movers. The refresh indicator is the white countdown timer next to the Discovery Pro label. Use Discovery alone or along with the Stream view to keep an eye on all the market’s movement.
The Discovery columns are sortable by clicking on the column heading name. This means you can order the columns from high to low in order to see either biggest gainers or losers in the market. Use the sortable fields in conjunction with the filters and search to sort a smaller subset of symbols.
Symbol - The stock's name as part of the Discovery results. You may mouse over to get full name of business or issue.
Momentum - Calculated using count data from the MOMO Stream. A positive value is represents more new daily highs of the day vs new daily lows of the day. The ability for a stock to continue to break prior highs or lows is a powerful indicator as sellers stay on the sidelines and buyers still see opportunity despite the rising price. (Obviously the inverse if going down).
Float - Filterable element which lets you idenifty stocks which may rapidly rise or fall due to limited number of outstanding tradable shares.
VWAPDist - New function which actively scans the market based on percent distance from VWAP (Volume Weighted Average Price). This allows you at any point to see which stocks are deviating most from this metric.
About VWAP. VWAP is important because it provides traders with insight into both the trend and value of a security. VWAP is a common indicator and historically known as the point at which large funds accumulate or distribute their holdings as it was deemed the most representative price to value for the day. Algorithmic trading has certainly found more contemporary ways to accumulate or distribute, but the VWAPDist is still a great way to uncover stocks pulling away from volume-priced action.
Uvol - Our abbreviation for “unusual volume”. We look at volume in premarket, normal hours and extended hours and slice the day into 15 minute snapshots and compare those snapshots to past 30 trading days. If current volume rises abnormally, relative to the market, it will rise to the top.
About Uvol. Our unusual volume implementation is unique and can highlight deviations independent of spikes in market open or lulls during lunch hour. Uvol may report peculiar percentages based on incomplete reporting on new stocks as well as thinly traded issues. Relatively unknown stocks getting interest during extended hours will rise to the top.
RelStr - Our abbreviation for “relative strength”. This indicator compares gains and losses relative to the SPY on a percentage basis. It is a timeframe sensitive indicator to help quickly assess performance.
Actions - Provide options for adding symbol to list of Favorites or to add to set an alert
Refine the Discovery View to your needs with one of the available filtering methods. Where sorting toggles the direction of the data when clicking on column headings; filtering reduces the displayed data based on your criteria.
Industries - Choose to filter Discovery by Industry and view the performance of only the businesses in the chosen industry. To deselect and show all options, just select Industry again.
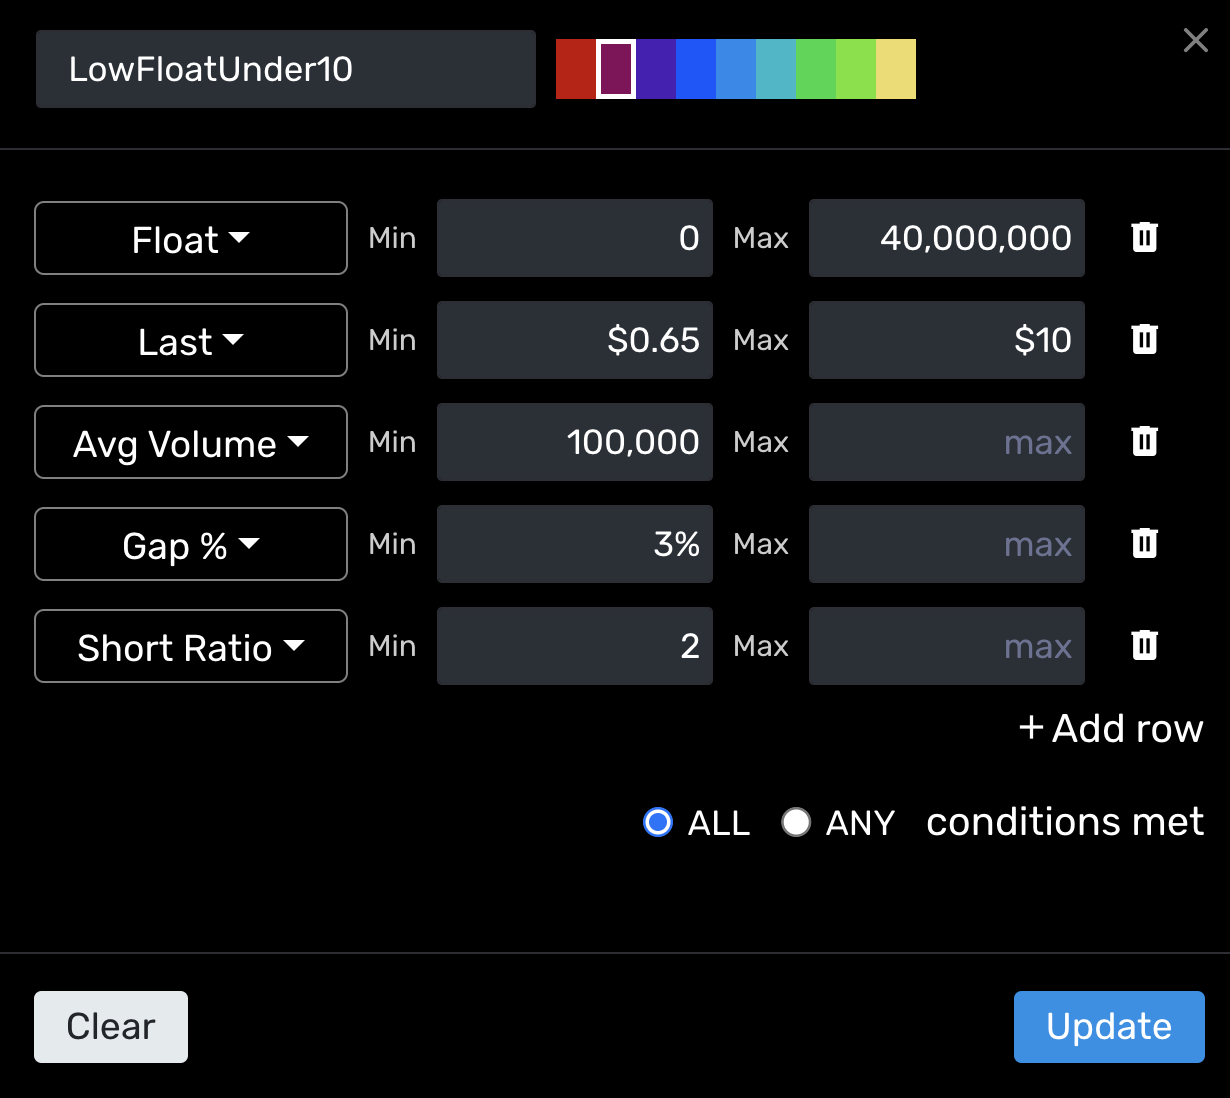
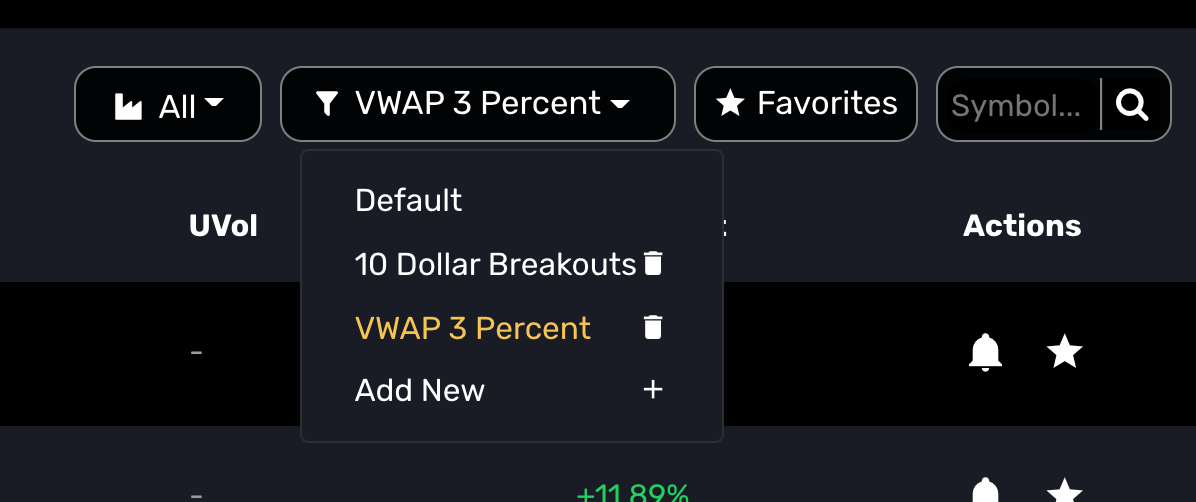
Custom Filters - Create and save your own filters based on select criteria. Custom Filters allow you to create temporary filters or saved filters. To save a filter, enter Filter Name and select "Save & Filter". For one-time queries, select "Add New", enter criteria and then select "Filter".
Saved Filters are available from the Custom Filter drop down for quick reference.
Favorites - Any time you click the star to the right of a symbol, you will create a new Favorite. Similar to a watch list but easier to manage. At any time you may click the Favorites button to see the performance. Select again to return to the full view.
Search - Top right option within the Discovery window. Enter the selected symbol to find the stock performance. (works great when setting up Favorites).
Expanded View - Select this icon ![]() on top right of Discovery to expand the Discovery window to full width and height of the browser. (This functionality is also available for the High/Low Stream view)
on top right of Discovery to expand the Discovery window to full width and height of the browser. (This functionality is also available for the High/Low Stream view)
CSV Download - Tap the Discovery Pro icon to reveal the option to download the current view. The download is limited to 250 rows and the CSV will capture and export data based on filter settings.
Refresh Timer - The Discovery View refreshes every 1 minute. The refresh indicator ![]() is located next to the Discovery Pro heading.
is located next to the Discovery Pro heading.
VWAP indicator is a 24 hour rolling weighted average which means that the value is structured on recent data. You can use the VWAPdist% to get an understanding of whether current day traders are profitable or losing money (if long) and also to help gauge if the security is over-extended and likely going to return to the volume-weighted mean. Many charting tools will plot the VWAP for you. What the VWAPdist% does is uniquely scan the market for those stocks starting to make moves after a relative period of low volatility. While historically an intraday indicator, MOMO Pro has extrapolated VWAP to provide weekly and monthly context.
Correlation between any of the fields is often likely, but it is in no ways mandatory due to the nature of a stock’s movements.
E.g.
Uvol could be up 1000% and the stock could drop back to a 0% gain/loss for the day. May occur after positive speculation on earnings that don’t live up to expectations. Or heavy selling into buying keeps stock relatively flat.
Momentum may report +100 and VWAPdist% may be a negative value. Scenario - Early morning gains held steady through the day and profits were taken at the end of day.
Percent gain may show 10% but momentum may be nominal. Percent gain is a function comparing current price to prior day close. Momentum is based on the number of new highs to new lows. Both work together, but spreads and volatility won’t see these tightly aligned. Scenario - AAPL may have a momentum value of a 100 and a gain of only 1% as the spread is much tighter than a stock with lower volume. Additionally a stock with a large gap first trade will account for additional deviation.
As name suggests, MOMO Pro+ builds on MOMO Pro to extend capabilities. These enhancements are implemented in Discovery and Notifications components as described below.
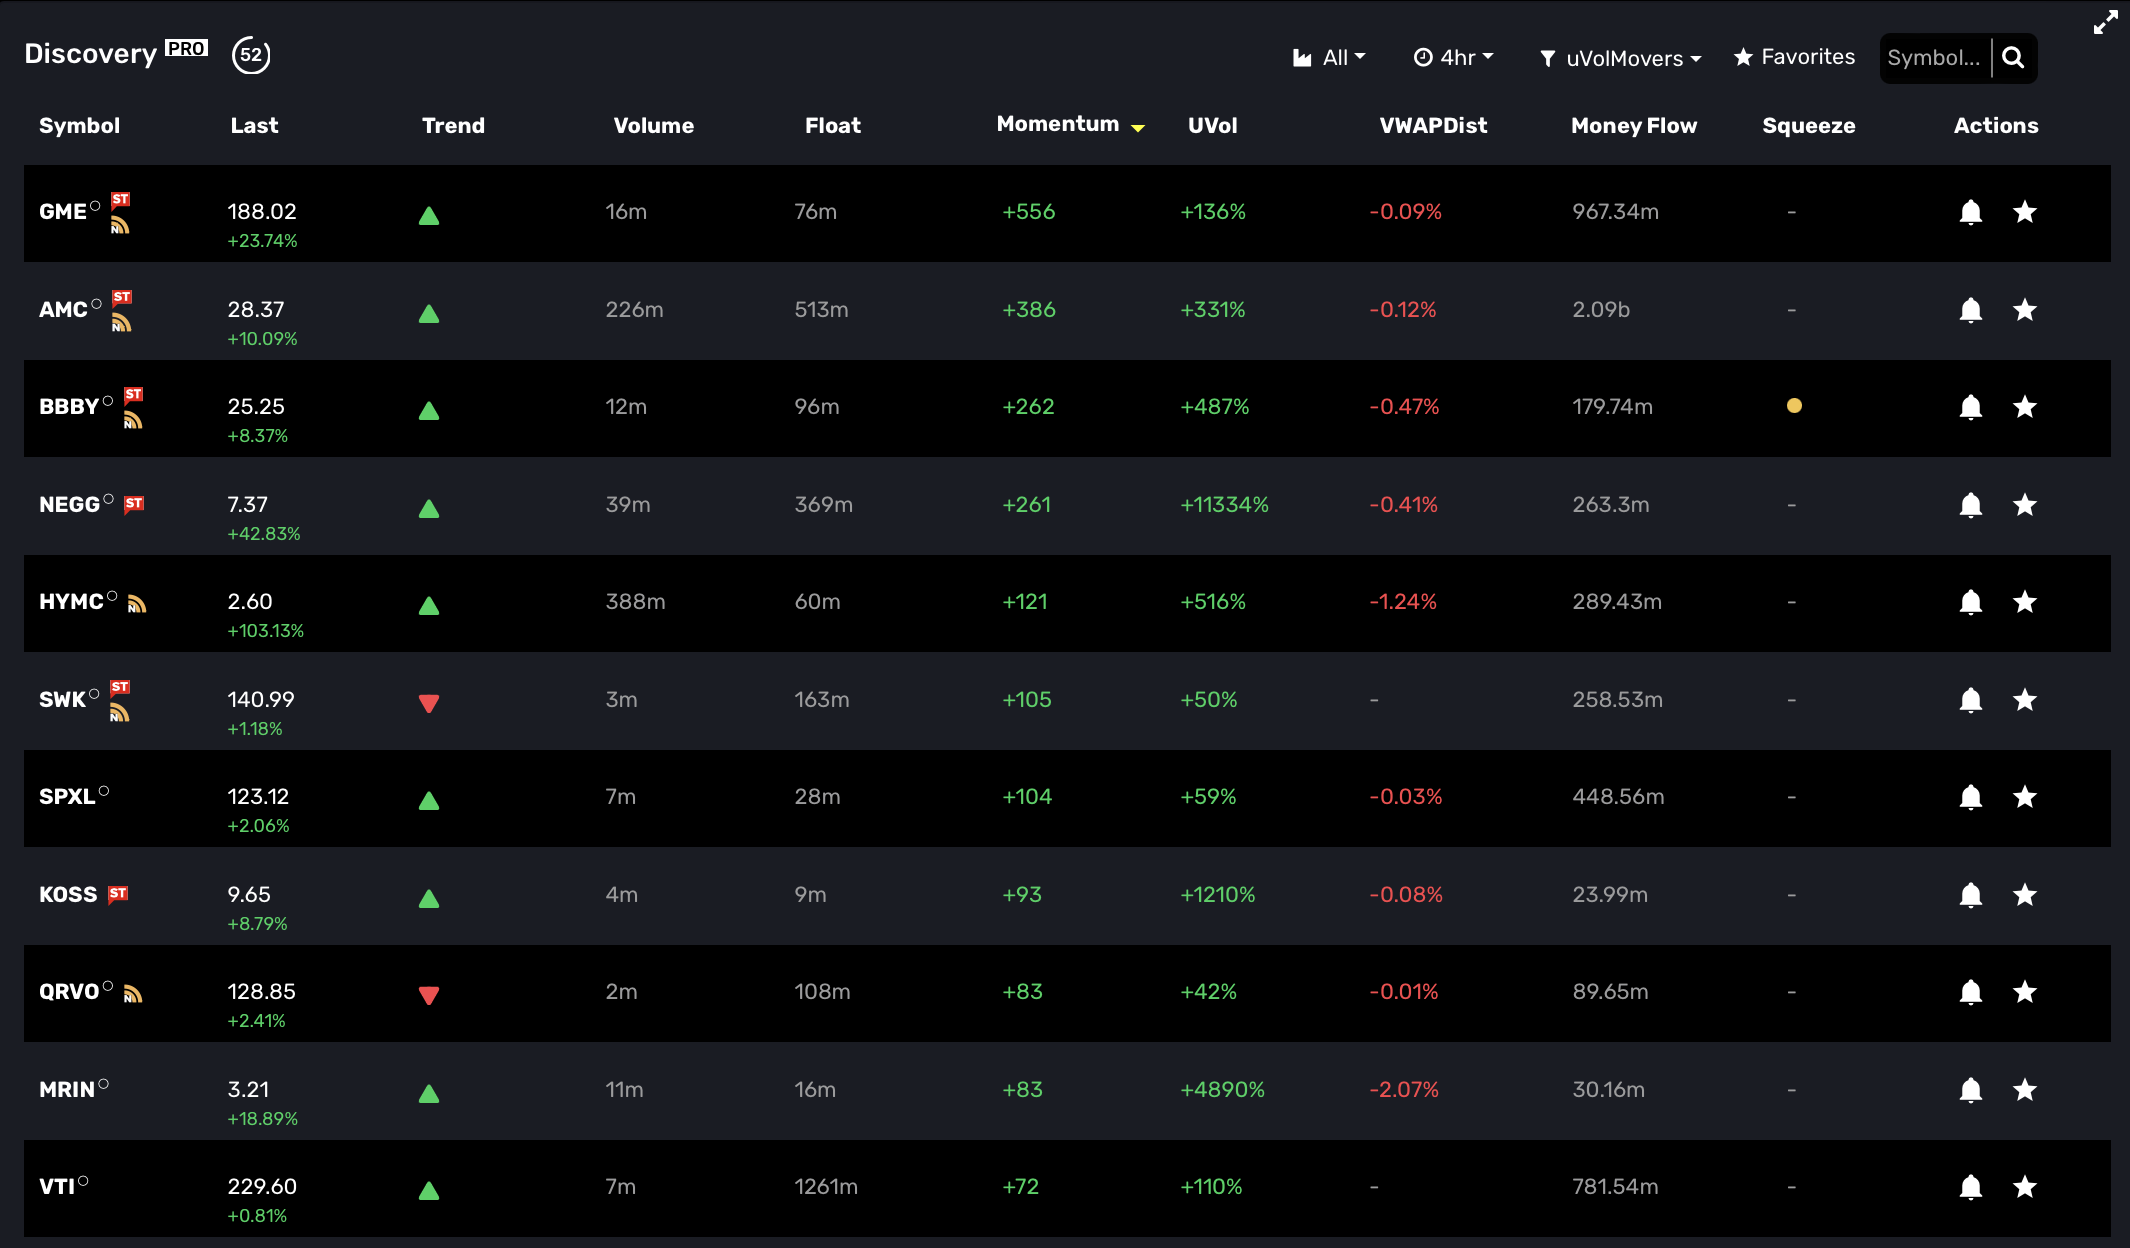
(Pro+) MOMO Squeeze - MOMO Squeeze provides TTM Squeeze scanning across the entire market to view stocks currently in a "squeeze" pattern, breaking out of squeeze or post-squeeze. MOMO Squeeze can be used across all timeframes and also with filters to provide custom views using available Discovery columns as filter criteria. Click on the MOMO Squeeze heading to toggle through the 5 different sort order and states.
About MOMO Squeeze. MOMO Squeeze is very powerful indicator and complements unusual volume to identify stocks in an imminent breakout. Our implementation is refined to work across all timeframes, but given the algorithmic complexity it may include some noise - particularly with low volume stocks trading with the shorter timeframes (15min to 2hrs).
MOMO Squeeze utilizes the TTM Squeeze approach and utilizes Keltner channels, Bollinger bands, EMA and average true range (ATR) to determine the squeeze states of each stock. All positions across entire market are recalculated every 60 seconds.
(Pro+) MOMO Trend - MOMO Trend provides timeframe based scan of equities' direction across entire market. If you have used Supertrend on charting applications you will see strong similarities. MOMO Trend provides a scan-based view of upward and downward bias as well as price point where the trend pivots across each timeframe. Advanced filters can be used to scan based on MOMO Trend and any of the other indicators based on your trading style. As an example a filter could be set to show "MOMO Trend = "Buy" AND Uvol = > "50%" and Price > "3%".
As with MoneyFlow, you can click the symbol's trend icon, to reveal the price when the trend changes. This is valuable for establishing stops and entry points and is timeframe dependent.
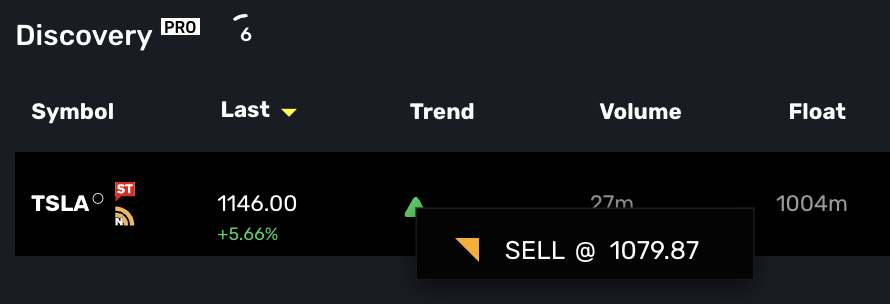
About MOMO Trend. The algorithm behind MOMO Trend and Supertrend have become known for their reliability in providing accurate trend direction as well as entry and exit points. Prior to MOMO Trend it was labor intensive using charts to get directional insight. Where basic smoothed average trend indicators provide a basic understanding of directional bias, MOMO Trend incorporates volatility to maximize trading profits by letting "runners run" and closing positions before big trend changes. MOMO Trend is highly complementary to other MOMO indicators and is fully implemented throughout the platform with availability in both Discovery Filters and Conditional Alerts.
(Pro+) Gap Scan - The Gap column in Discovery shows you the current gaps versus prior day close. As with all Discovery columns, Gaps is sortable simply by clicking on the heading label. There are several strategies around gap trading which typicaly garner attention and trade volume. Our implementation is based whereby we compare market open against prior day close. This provides users with ability to identify breadth of gap using our filter logic. In other words, you may track a gap from 1% (or dollar-based as chosen in Discovery settings) up to a higher percentage (e.g. 10% or dollar equivalent). Additionally, our logic is unique in that we account for gap fills and actively adjust the Gap value if trades begin to fade the action. .
About Gap Scan. The Gap Scan is available to Pro+ traders in Stream as well. Meaning you may filter the Stream’s high/low breakouts with a certain Gap percentage. The Gap scan is also available as a pararameter with Conditional Alerts. It's worth mentioning that our Gap Scan is available in pre-market and based on opening pre-market trade.
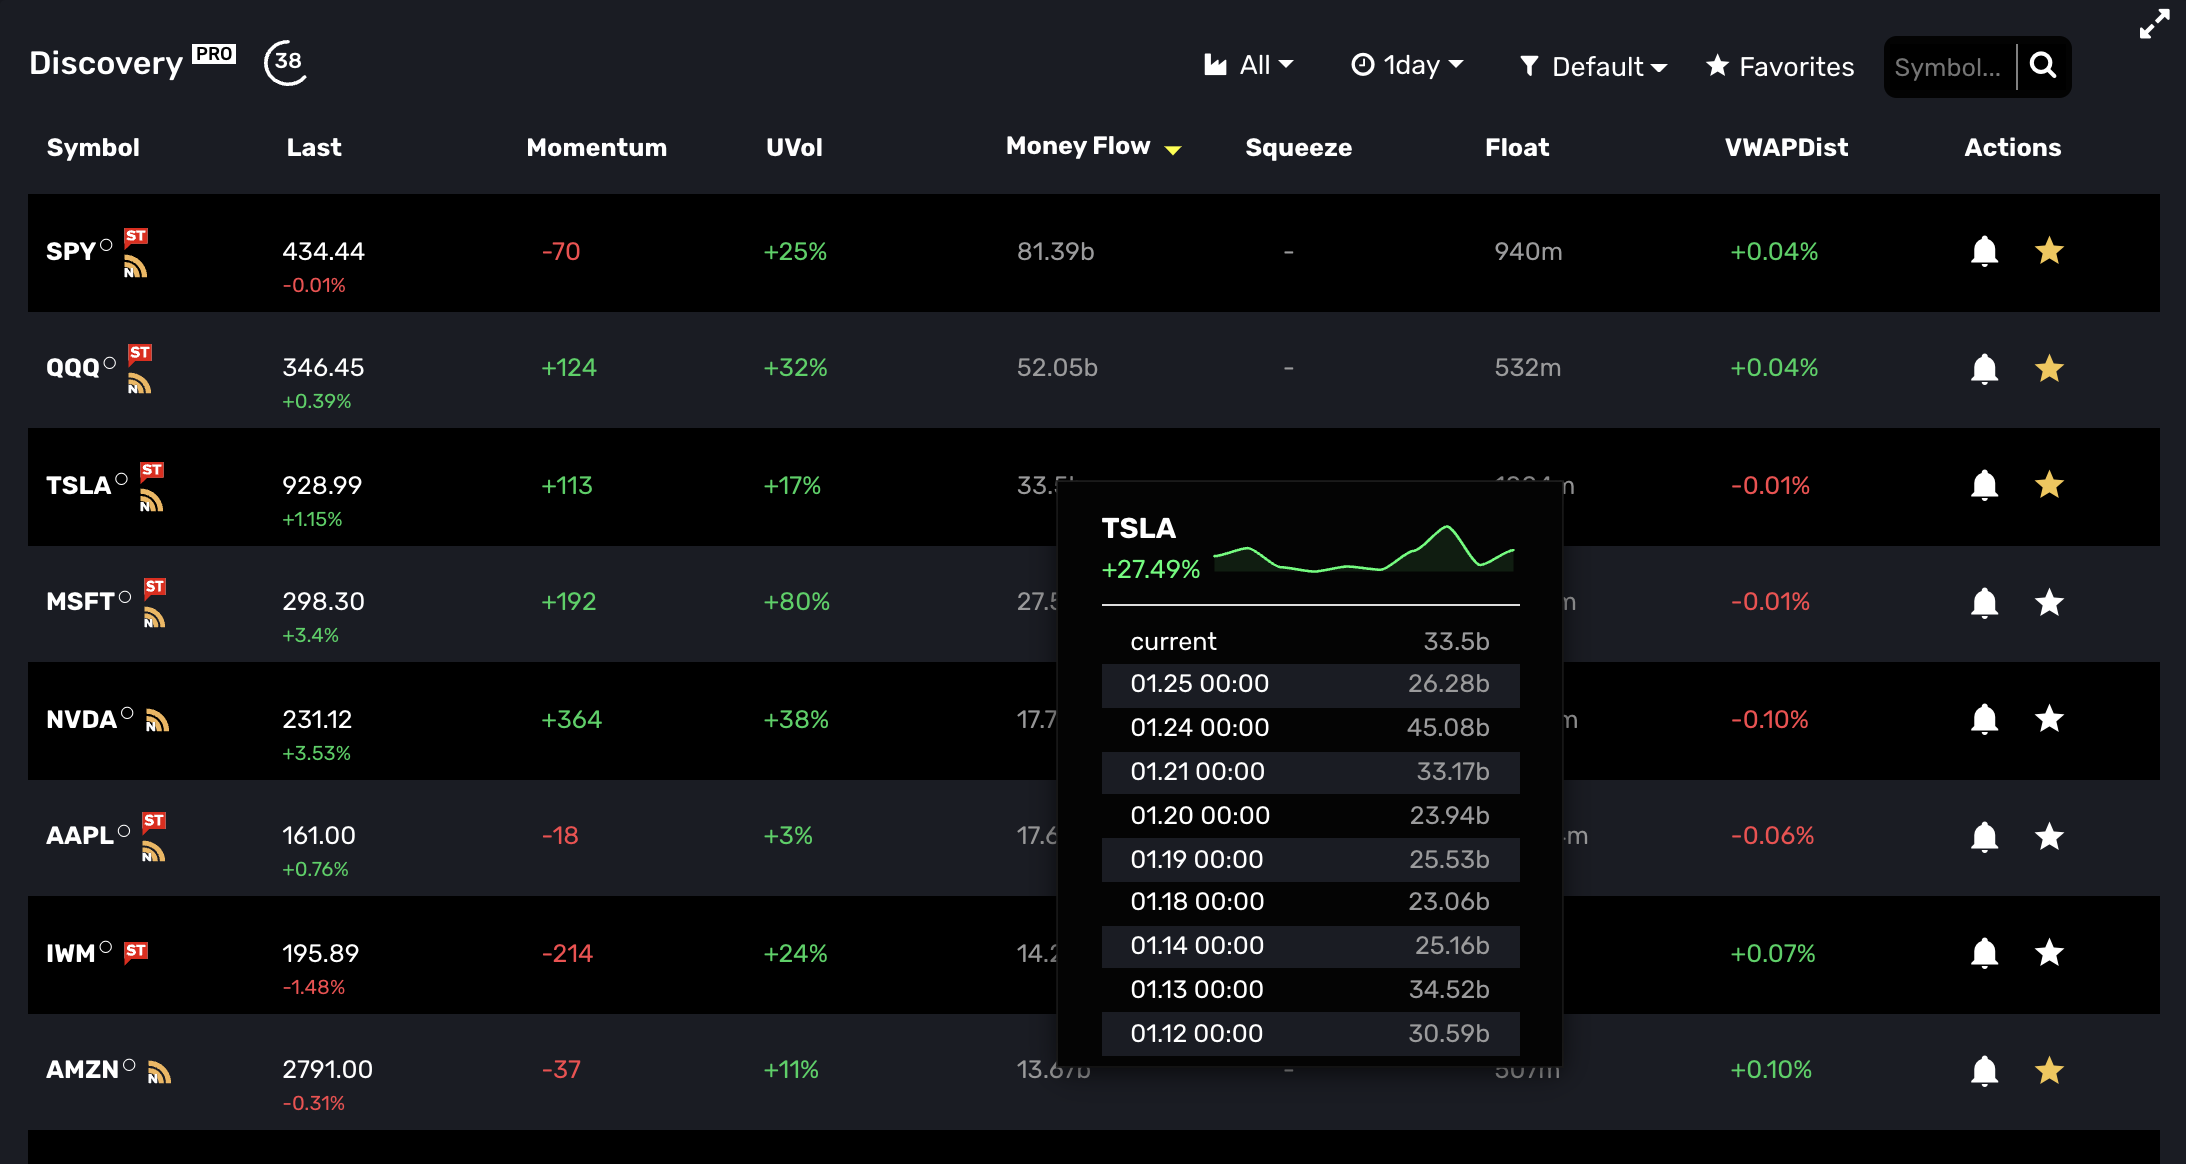
(Pro+) Money Flow - provides a stocks true interest level relative to other stocks and its own historical flows over time. This is useful to assess relative investment being traded to track liquidity and interest. Our implementation is dynamically calculated per timeframe and updated every minute.
About Money Flow. The Money Flow calculation uses relative timeframe VWAP-based price multiplied by corresponding timeframe volume to determine total Money Flow. This is also known as “Dollar Flow” or "Dollars Traded”. To use, click the column heading to sort and see those stocks with most flow in current period relative to all other stocks. If you click on a money flow value for a particular symbol, a pop-up showing the Money flow history of current period vs. prior history will appear. The pop-up also shows the percent change of current period vs. most recent prior period. MoneyFlow is also an available filter in Discovery. There are two money flow filters available. You may chose to filter by the % change or the absolute dollar range.
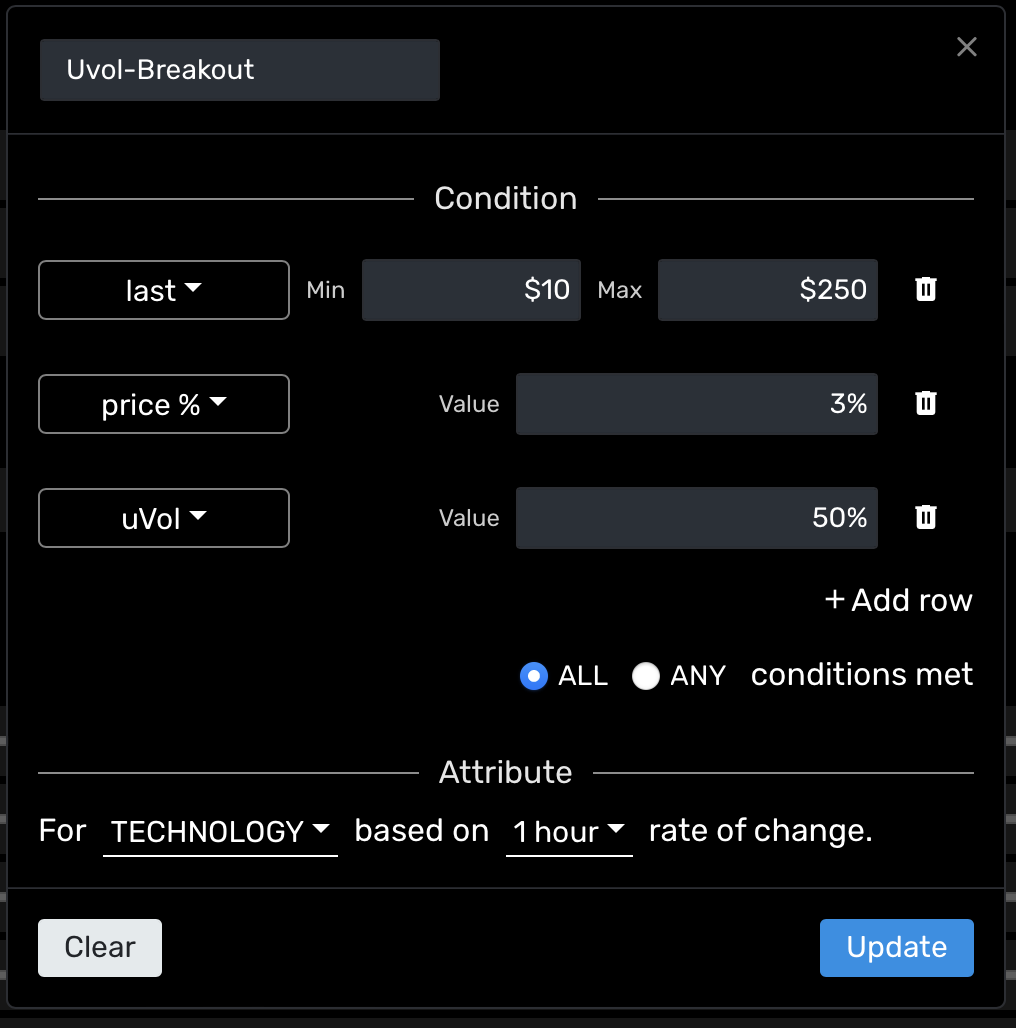
(Pro+) Conditional Alert - Custom alerts built on your critiera. Where other MOMO alert types require an stock symbol, Conditional Alerts report the symbols which meet the set criteria. Conditional alerts may be configured using any or all of the available criteria including; avg volume, float, price, price change%, momentum, unusual volume, VWAPdist, moneyflow range, moneyflow change%, and MOMO squeeze.
About Conditional Alerts. Conditional alerts also use category and timeframe attributes in their definition. Understanding how timeframe impacts the alerts is important. If timeframe is set to 1 day and you wish to report all stocks moving more than 1%, then you will be notified based on the prior day's close for every 1% change. Repeated values are not included, but stocks which achieve incremental 1% gain will be alerted. If the tiemframe is set for 1 hour, the evaluation is similar to 1 day, but you are now scanning based on a 1% change versus the close on the prior hour. Alerted stocks will not be repeated unless they achieve an additional 1% gain. All conditional alerts are reported once every 3 minutes.
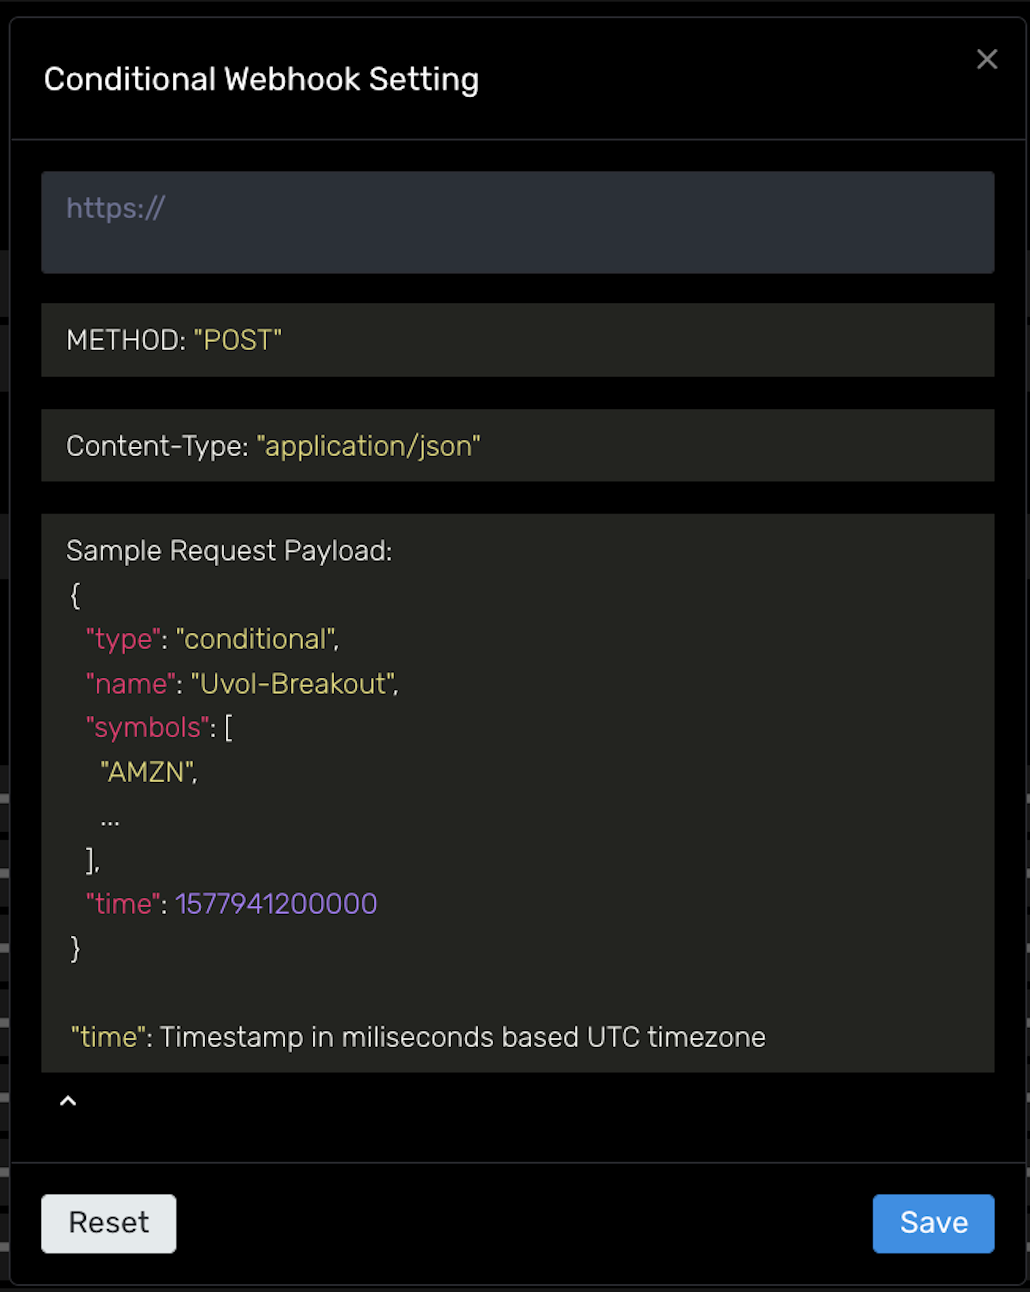
(Pro+) Webhook API - Directly integrate your alerts into your trading system or messaging tools. Every notification type can now be integrated via our webhook. This is particularly powerful when used with the Conditional Alerts. MOMO Pro+ users will see the code link next to the alerts which support the Webhook API as shown below.
To use, put your the URL provided by your integration endpoint into the URL field as illustrated and save. The available API payload data is shown and is unique per alert type.
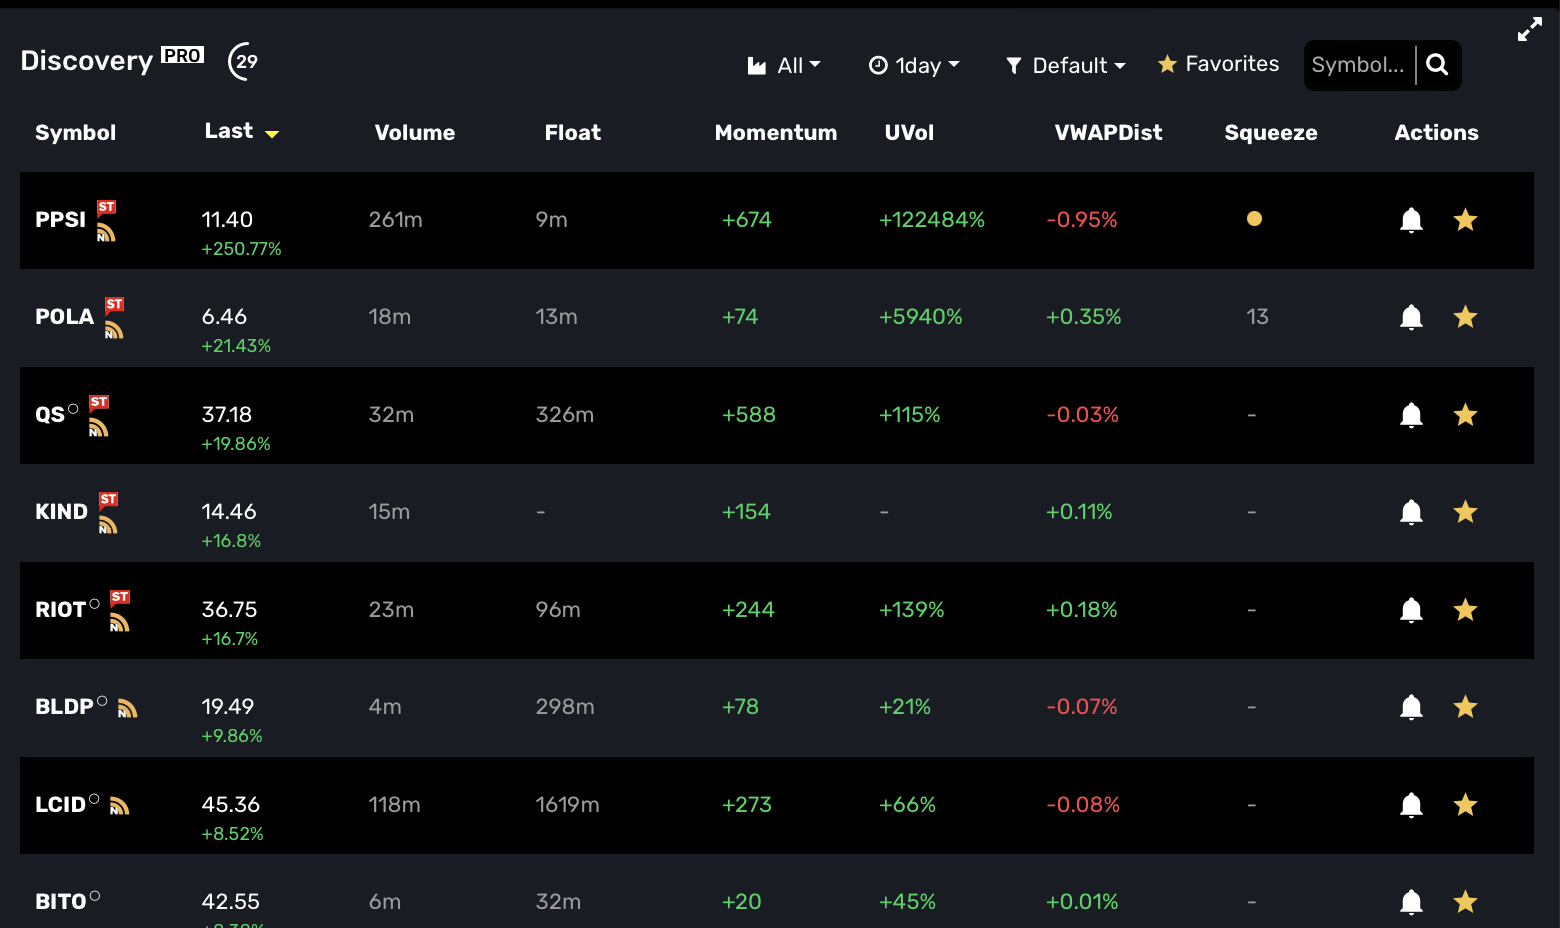
It is important to note that TTM Squeeze has typically only been available while charting with a single symbol. To modify and provide our ranking and tabular scanning view we had to incoporate the presentation of the data in a meaningful way. We did this by creating 3 phases of MOMO Squeeze. The first phase is "PRE". This phase indicates stocks currently in a squeeze pattern. For each timeframe "bar" the stock is in a squeeze we increment the count. So a PRE squeeze of 5 while viewing the 1hr timeframe, would mean that the stock has been in a squeeze pattern for 5 hours. The "Now" phase is highlights stocks which are currently "firing" a Squeeze breakout for the set timeframe. Lastly, the "POST" phase captures up to 5 post squeeze bars. These are illustrated as negative values.
In the above Discovery image you can see that PPSI is currently firing, while POLA is showing it is in ongoing Squeeze over daily timeframe. This is notable because while POLA is having a sizable daily gain, its volatility dictates it has not broken the trend in a meaningful way. This is supported by the charts which show high volatility and spikes only a few days prior.
For a deeper illustration - Let's say AAPL is enterering a tight trading range from 150 to 155 over 15 days and MOMO Squeeze identifies this as a legitimate squeeze. On day 15, the PRE Squeeze count would show "15" on MOMO. The following day AAPL breaks out of squeeze and touches 157 and MOMO Squeeze validates this with a solid orange circle to show it is breaking out (aka firing). Two days later, you can see there was a recent breakout as the value is now post breakout and has a value of "-2".
You may set browser based desktop alerts to stay notified of specific breakouts with the Notification menu settings option. This is useful to help ensure you get instant notification of a stock’s movement.
There are 5 alert types you may set. Each will show in Alert History as well as in your operating system notification system.
Halt Alert - Halts provide fast notification into when a stock is halted. When enabled it will poll Nasdaq and report on all stocks which are halted with reason code (e.g. volatility, news pending)
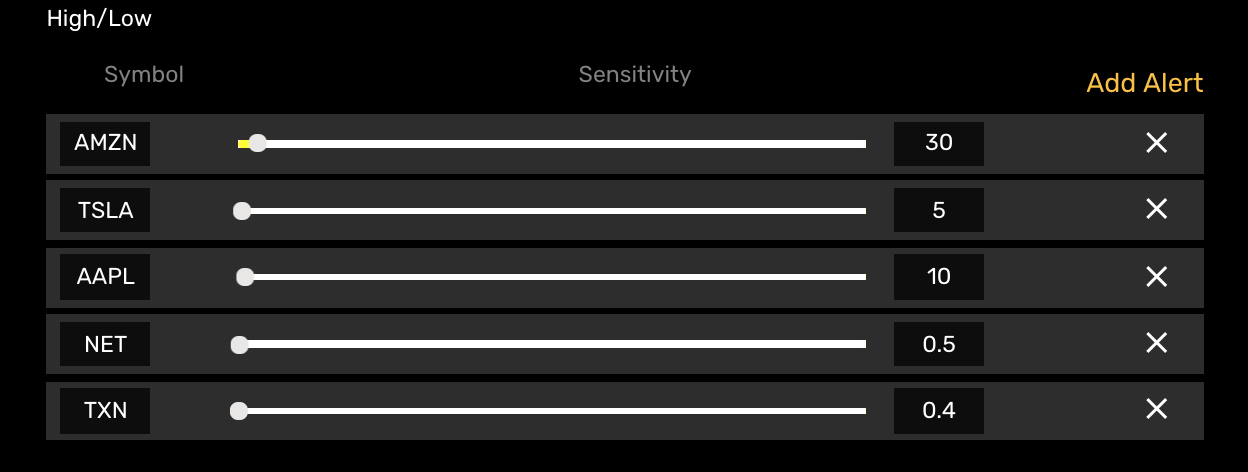
High/Low Breakout Alert - Alert notifications are sent for every new high or low of the symbol. You may adjust the frequency of the alerts by adjusting the alert sensitivity (dollar based rate of change).
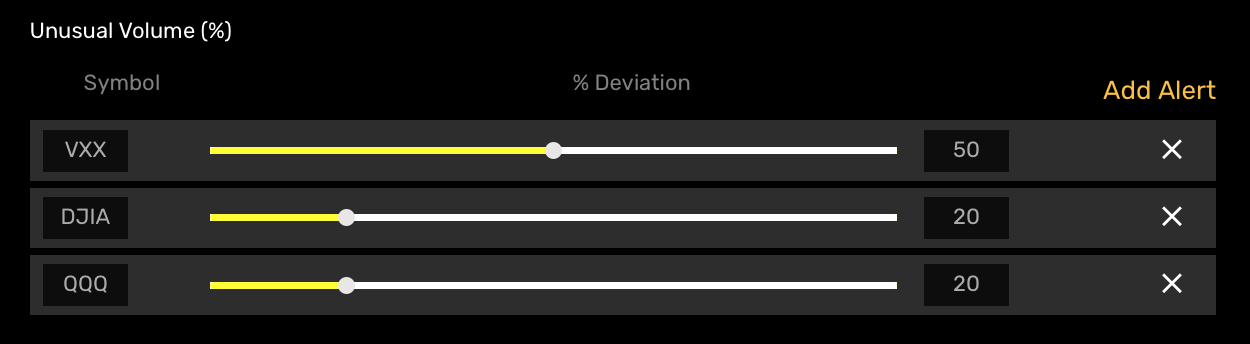
(Pro) Unusual Volume % Alert - Provides alerts based on volume relative to prior 30 days average. You may configure frequency of alerts based on percentage variance from average.
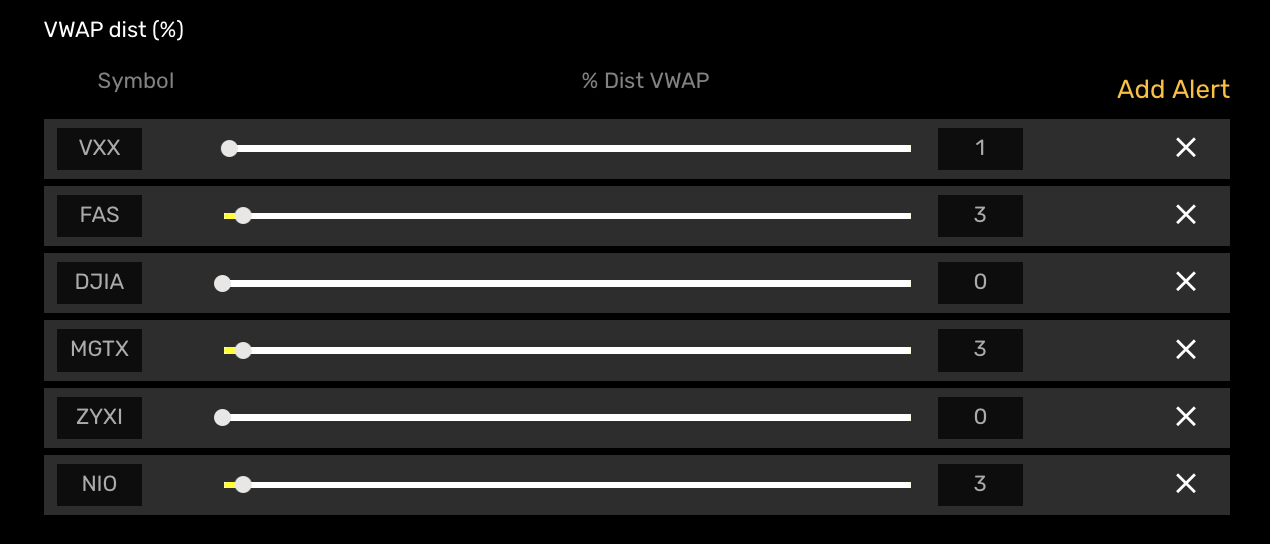
(Pro) VWAP Distance % Alert - Alerts based on symbol's current price percent variance from VWAP. (Start with a lower setting and adjust based on volatility)
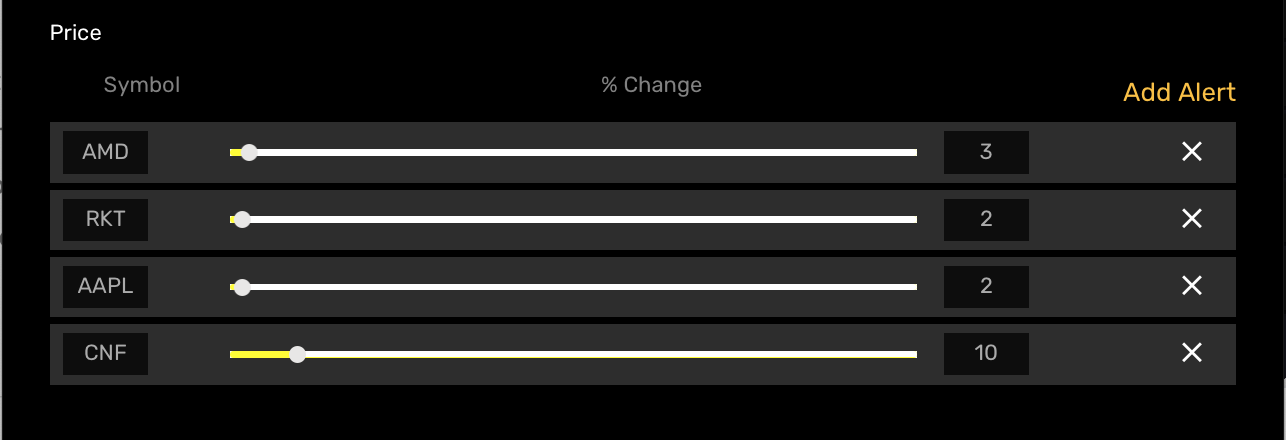
(Pro) Price % Alert - Alert notifications based on a stock's percent change.
(Pro+) Conditional Alert - Custom alerts built on your critiera. Where other alert types require an entered symbol, Conditional Alerts report the symbols which meet the set criteria. Conditional alerts may be configured using any or all of the available criteria including; avg volume, float, price, price change%, momentum, unusual volume, VWAPdist, Moneyflow range, Moneyflow change%, and Squeeze.
MOMO and MOMO Pro users: Review Alert Settings for configuration details.
MOMO Pro+ users: Review Conditional Alerts for additional configuration details.
Within Settings (accessed from the menu in top right of dashboard) or from momo.mometic.com/settings you have the option to configure General Settings, the filters for the MOMO high/low Stream, Set notification alerts and adjust the Discovery layout.
The available sub-options for General Settings are Options and News.
The Options setting provides you the ability to globally filter or adjust how you want stocks which have underlying options to appear.
Icon - When this option is selected the ° indicator will appear next to optionable stocks on the Stream and Discovery views.
Filter - When selected, will ONLY show equities with underlying options in Stream and Discovery views.
Off - Does not show the ° indicator or filter optionable stocks. "Off" is default behavior.
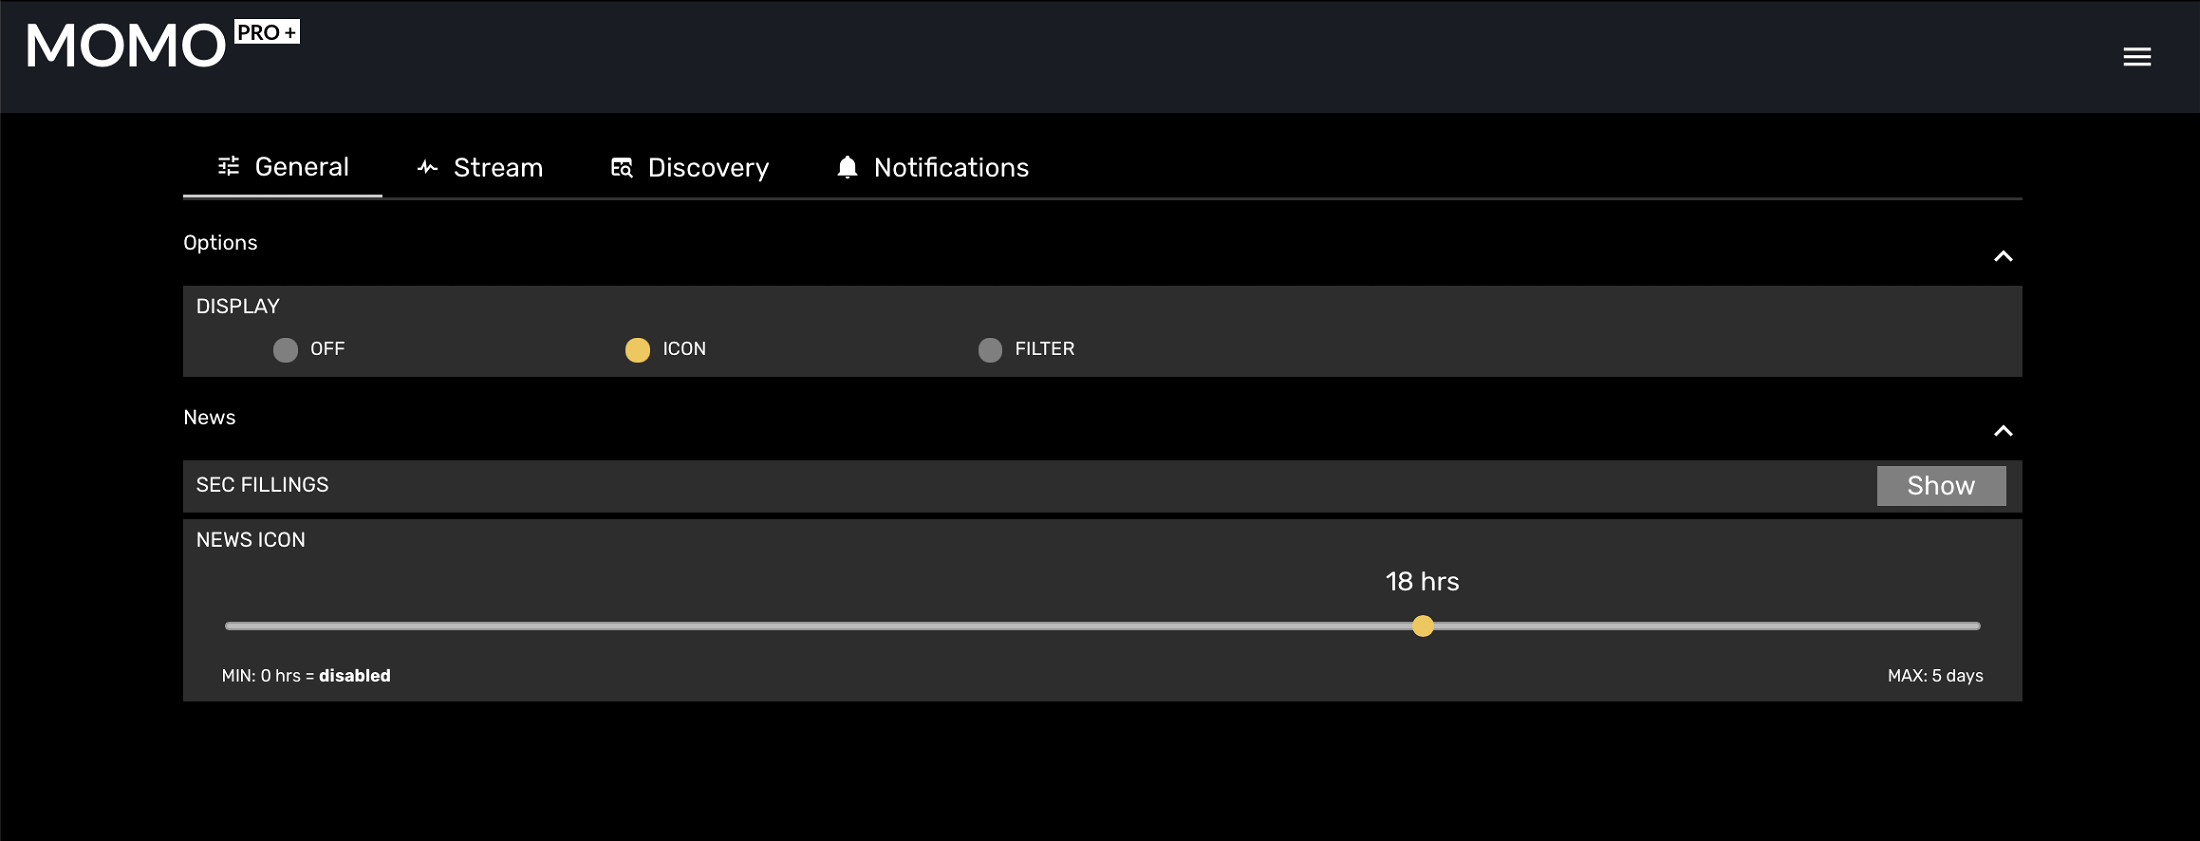
SEC Filings - adjusts whether or not to show SEC filings in News view in order prevent flooding results. SEC filings will still appear in results of individually searched stocks.
News Icon - is displayed to highlight recent news on the Stream and Discovery views. Adjust slider to configure how far back in past MOMO should consider news as “recent”.
If evaluating MOMO Pro for scanning peformance and breakouts with Options set to "filter" be aware many small cap breakouts do not have available options and will not be shown. Recommend leaving setting to OFF or Icon setting initially as many new users set to filter and don't realize the impact.
To adjust the Streams, select the desired tab and set accordingly. Either Stream may be assigned to one of 4 Types and one of 3 Modes. It's worth noting the Custom and Filter options will support unique configurations or stock listings. (e.g. If Stream 1 and Stream 2 are both set to "Filter" you can have different settings for each.) We recommend using the color coding feature to help quickly identify.
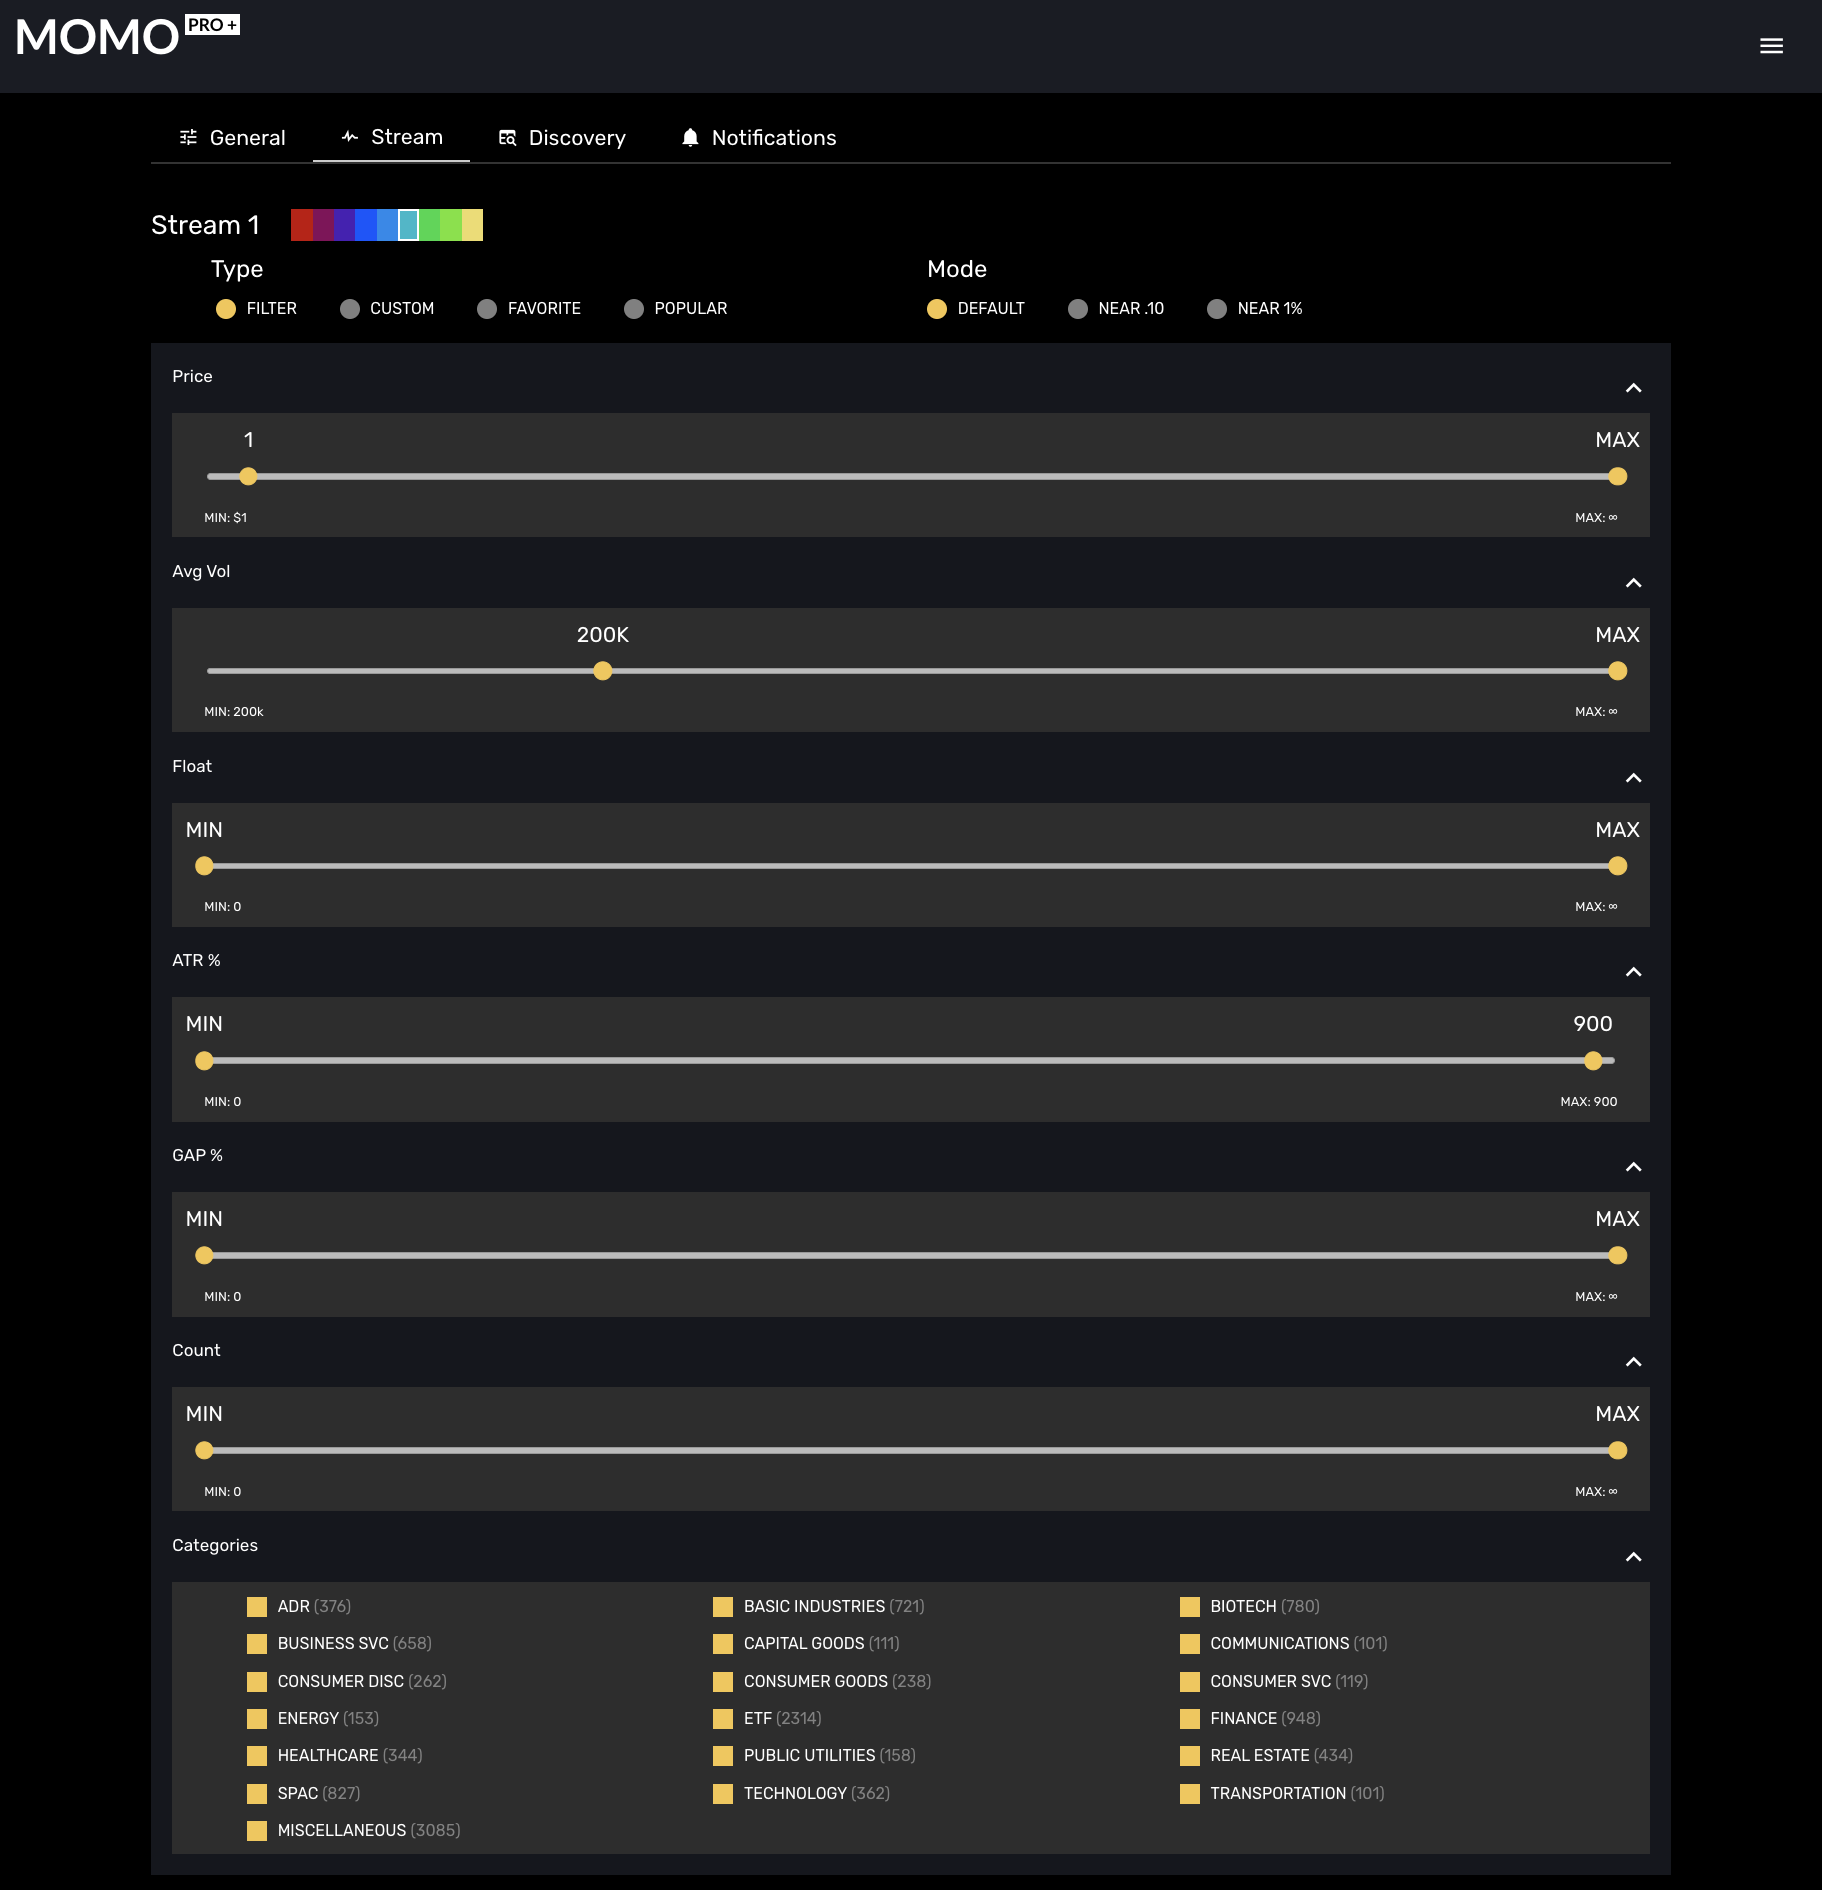
The 4 available Types for Stream 1 and Stream 2 are:
Mode settings provide alter the reporting of values in Stream. The 3 available Modes for Stream 1 and Stream 2 are:
The Filter and Custom selections have additional configuration available. Popular and Favorites do not have additional values, but ensure when selecting "Favorite" you have added an adequate number of Favorite Quotes for the functionality to be useful.
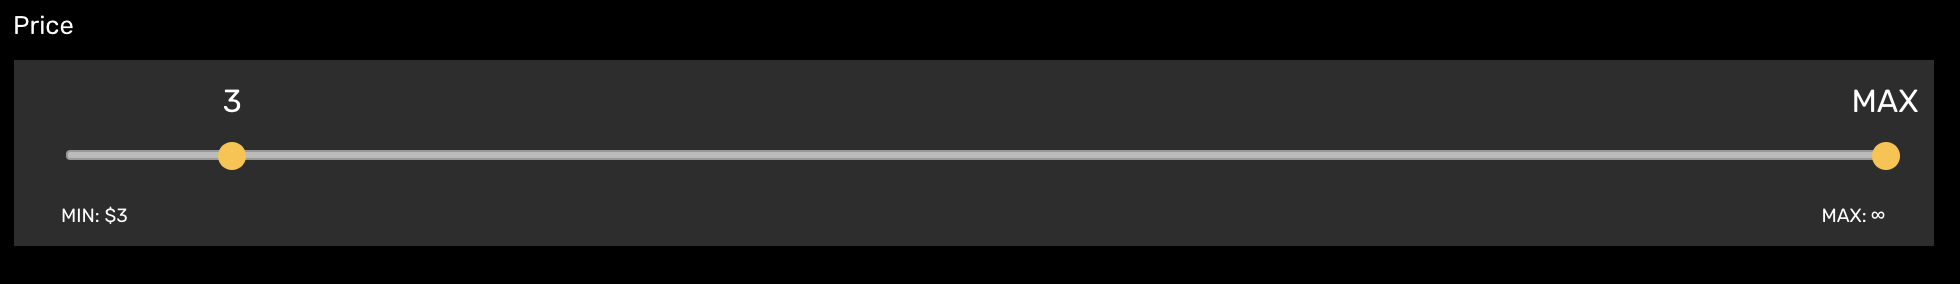
If there is a particular price range you wish to display, the price filter slider that can be set to accordingly. Keeping the slider set on the MIN and MAX will ensure you are receiving all available stocks and equities.
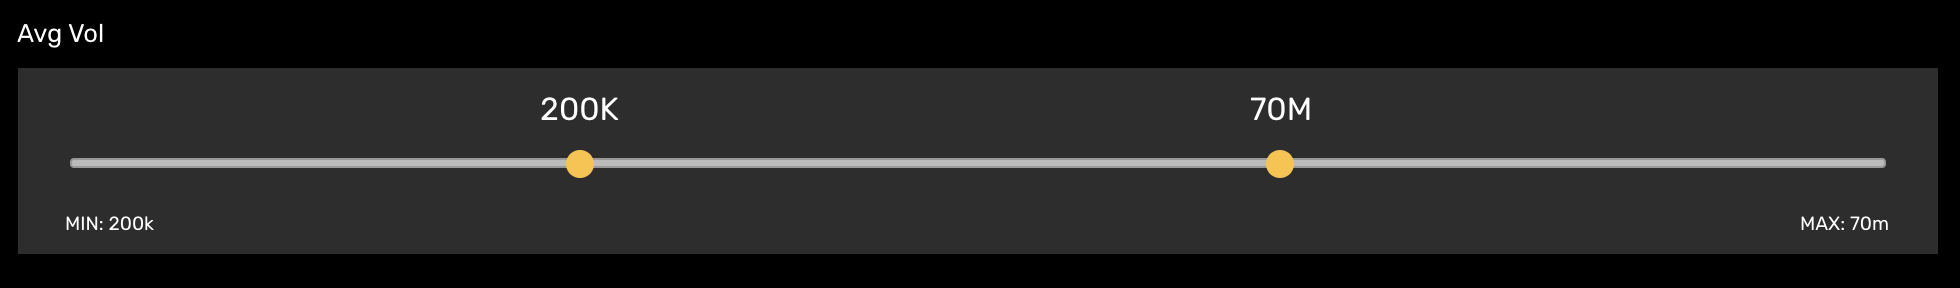
If you prefer to ignore low volume symbols or focus on higher volume stocks you can set the volume filter to accommodate. When the slider remains on the MIN and MAX values, no volume filtering is being applied. The average volume filter is based on 10-day moving daily average.
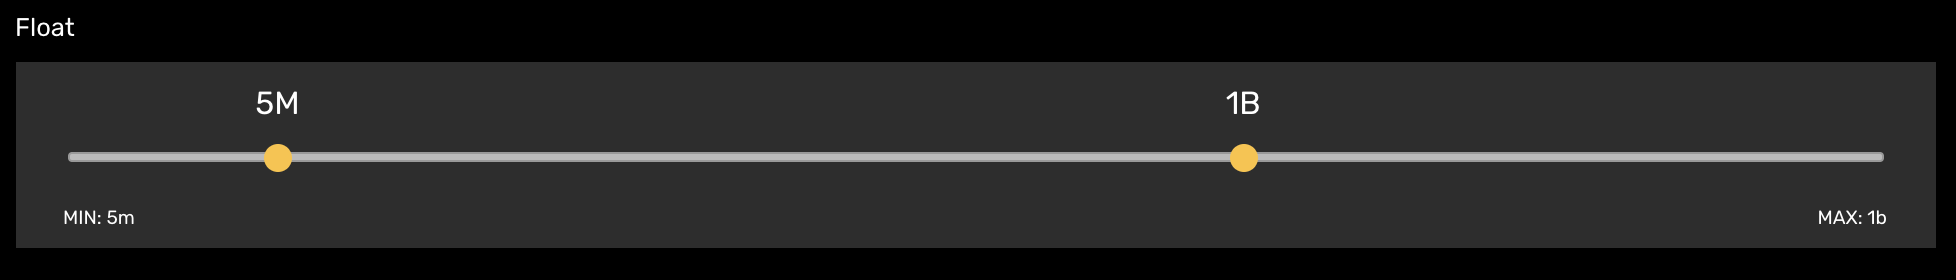
The float filter provides optional way to focus on businesses based on outstanding shares. When used in conjunction with price you can refine scan businesses based on market cap.
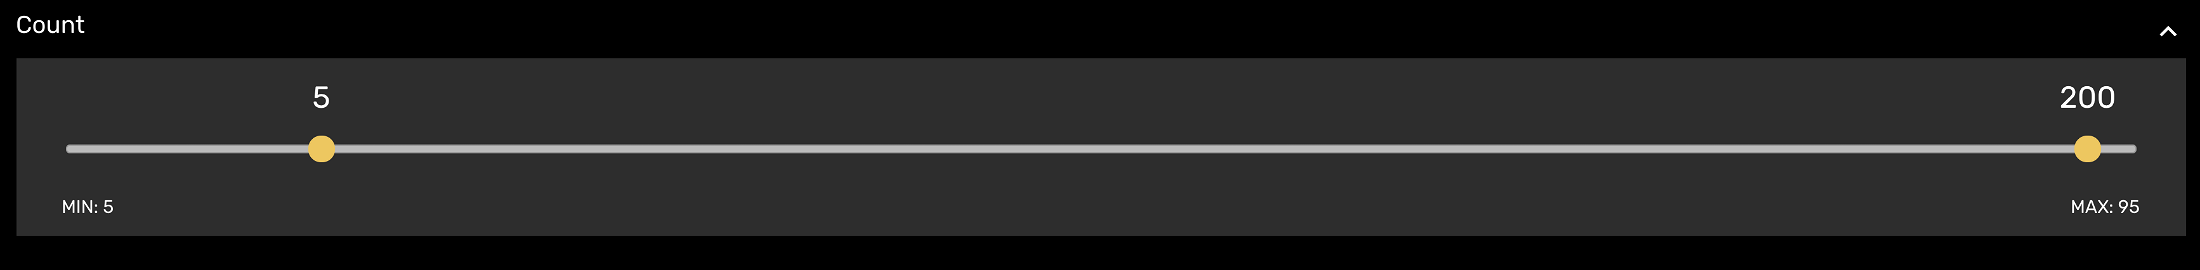
Count is the sum of new highs (or lows) of the day. Adjusting this filter allows you to reduce those symbols just making a preliminary move (increase minimum value) or those which have had an extended run and possibly risky to chase (decrease maximum value).
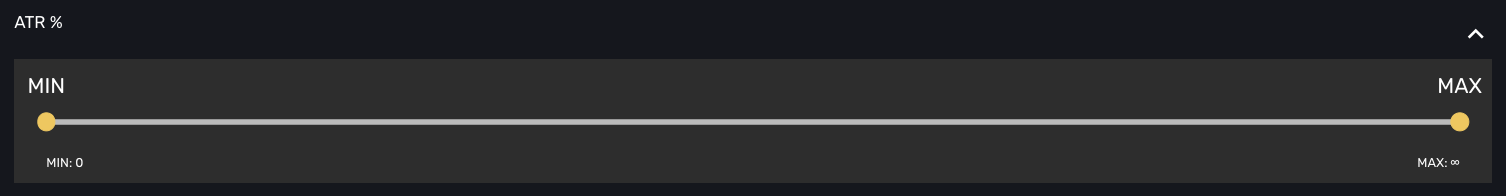
ATR% is a measure for evaluating volatility (Average True Range). We express as a percentage to provide a comparative value against the market. (This is a premium feature only available in MOMO Pro+.)
Gap% is a filter for identifying stocks making higher highs or lower lows with a Gap. We express as a percentage to provide a comparative value against the market. (This is a premium feature only available in MOMO Pro+.)
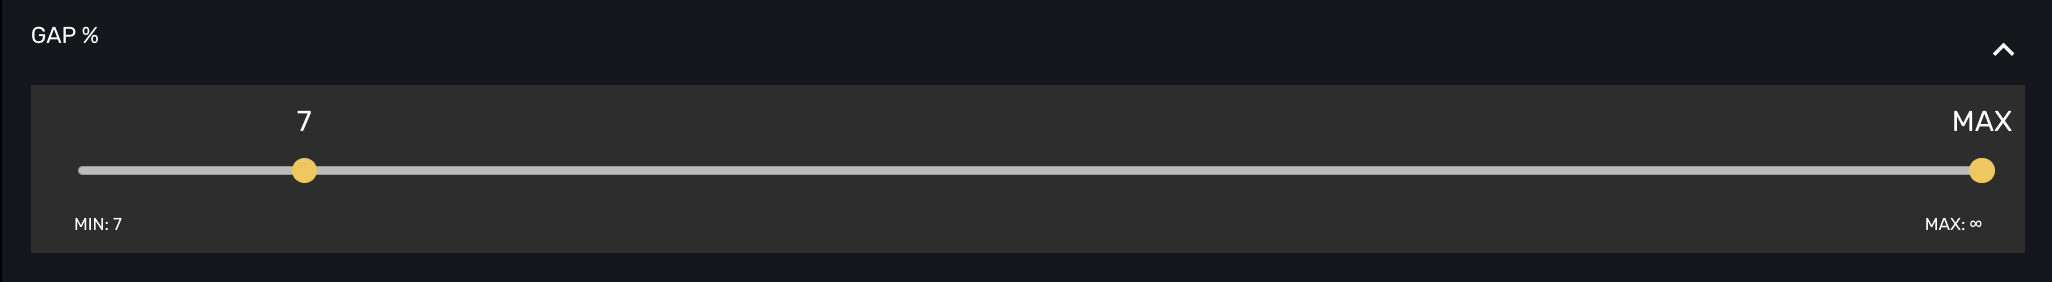
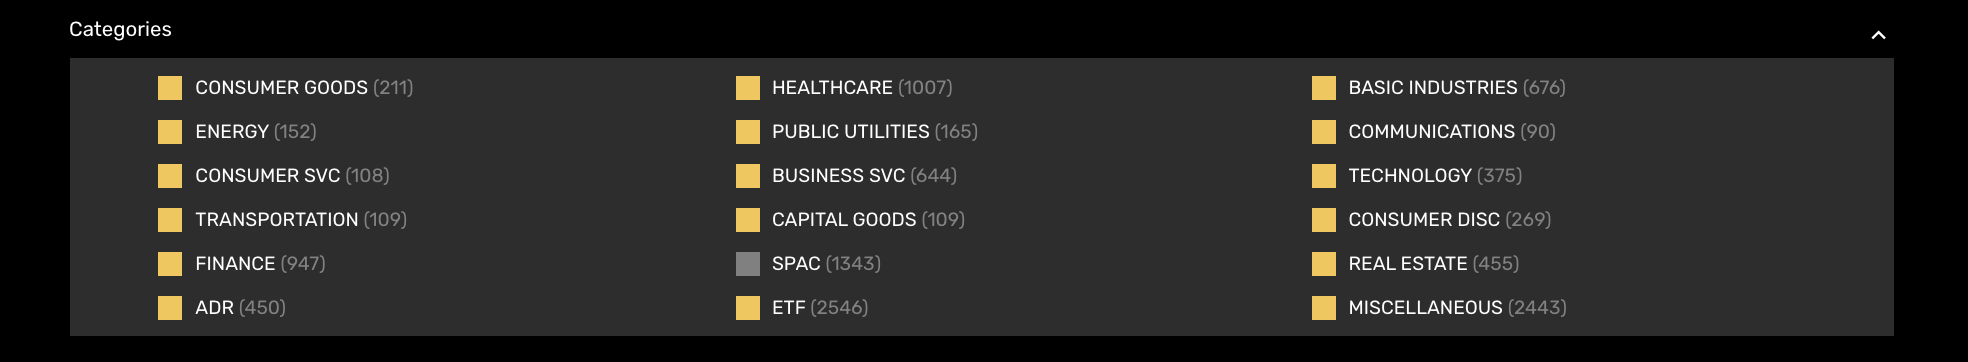
Selectively removes particular stocks from the available 18 categories to narrow your focus. Use the category filters in conjuction with other Stream filters to refine as needed. For example, you may set to only see symbols in the “Energy” category with a price range $5 to $20 and average daily volume of greater than 100k shares.
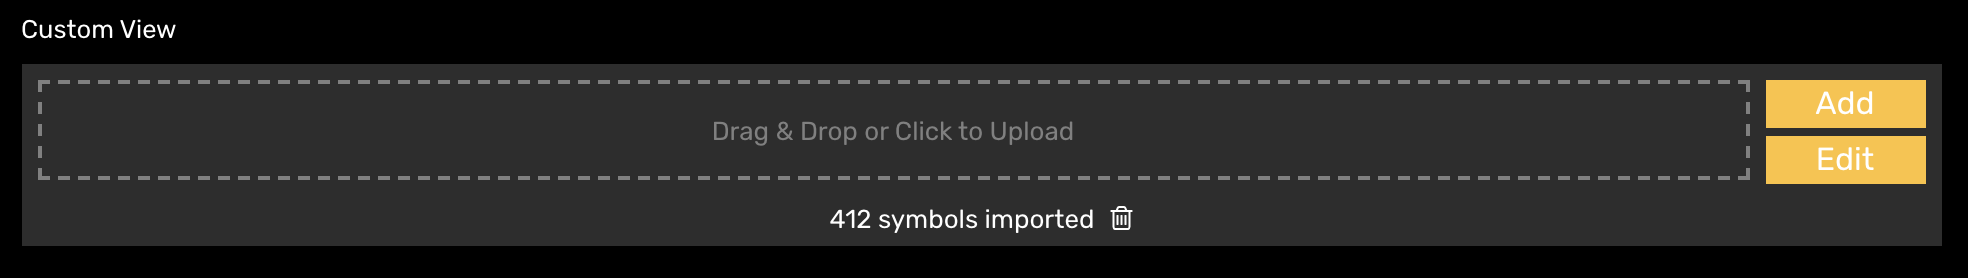
The custom Stream is designed to provide dedicated view of a personal list of stocks. Examples include a watchlist, SPACs list, emerging biotechs list, and high short % list. Drag a CSV file of up to 250 symbols to create a custom MOMO stream. You may optionally add them manually with the "Add" button. To remove individual symbols select "Edit" or click the trash icon to delete the entire file. Symbols not recognized by MOMO will not be processed.
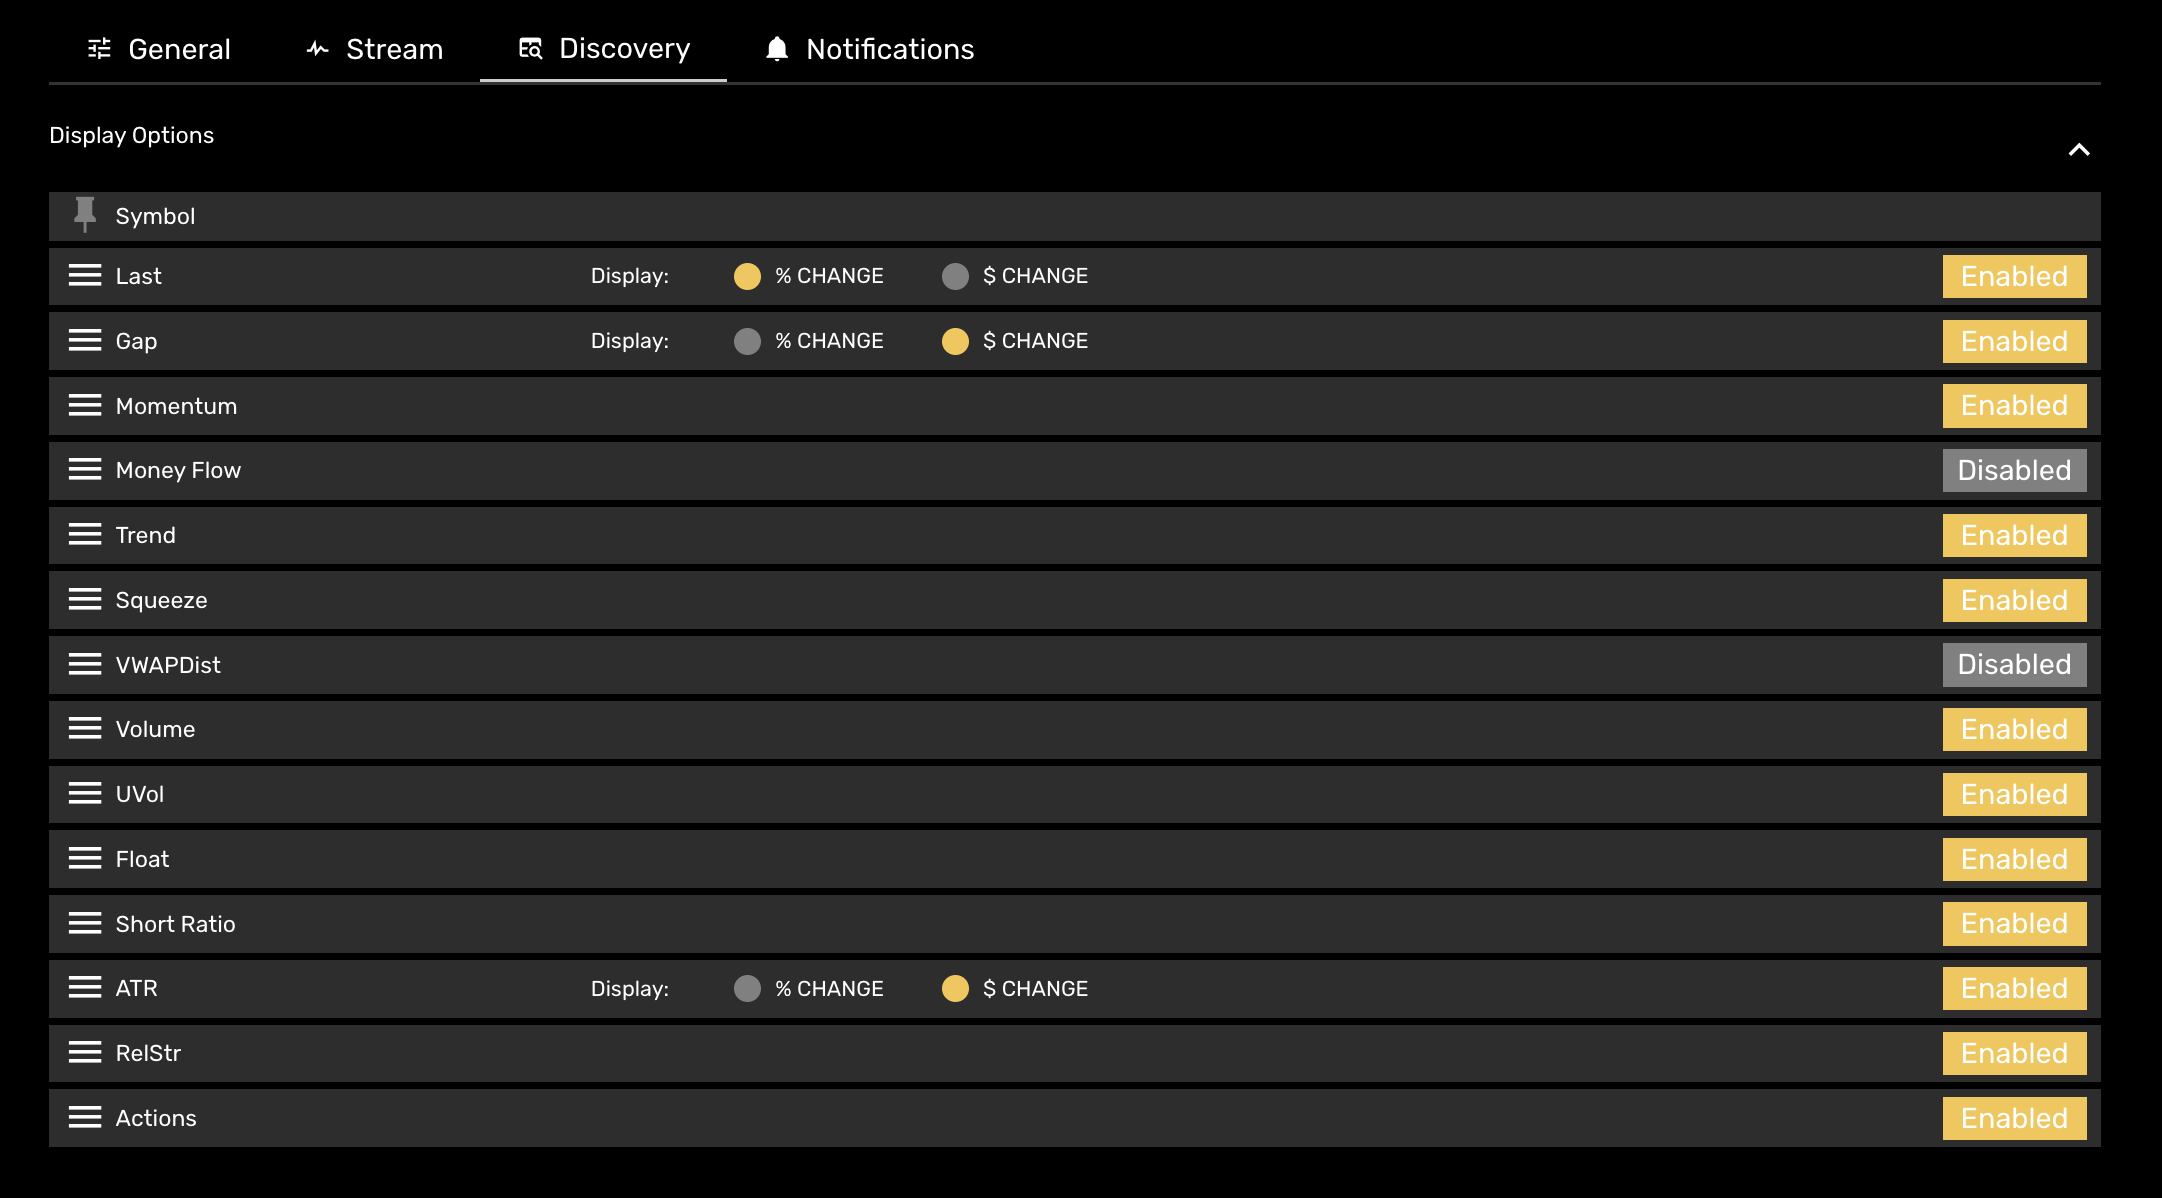
Most of the options on Discovery are configurable on the dashboard, but display options are set in Settings. Display options can hide columns entirely and adjust ordering. To adjust order, drag columns to preferred order. These settings are useful for fitting desired data into mobile browsers
Assign life-like voice to various MOMO zones keep track of market movement audibly. To start, use Add Voice selection, chose assignment area you would want audible output, the voice option, as well as whether you want the response said as the symbol or the corresponding name of the company or ETF.
Click the settings gear to slow down the notification rate. This may add a slight delay to the output during periods of busy market activity.
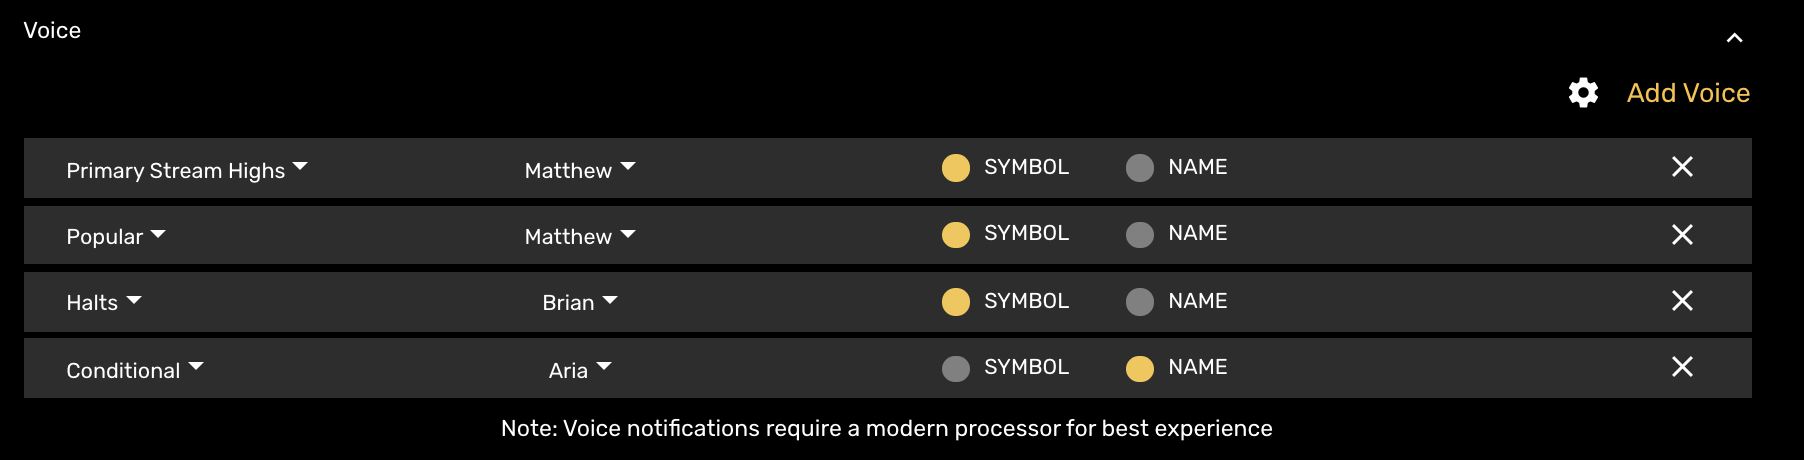
NOTE: You must enable sound and/or unmute browser to hear sound output.
Each of the 6 alert types can enabled or configured under Notification settings. (including Conditional Alerts )
Enable for notification when a stock is halted or resumes trading. This notification occurs within 1 min of Nasdaq issuance.

Base notification which works with the Stream. Sensitivity is the rate of change based on price.
MOMO provides a simple account management and registration function to review , upgrade, or cancel your subscription. You may also use to update your password or payment details. The account management functions are accessed via top right “hamburger” menu within the dashboard view.
We strive to do our best and look forward to hearing from like-minded momentum traders.
Feel free to contact us either by email or phone.